filmov
tv
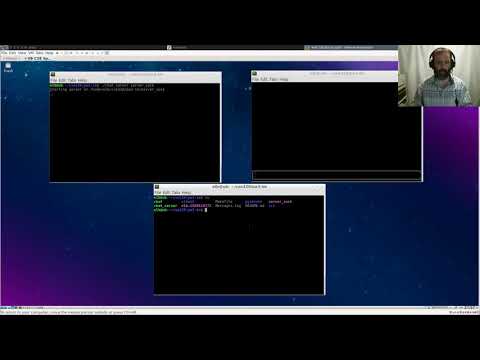
gdb debugger attach to a real time process in non stop mode

Показать описание
gdb non stop mode is a way to execute or attach a process supposedly without stopping the processes. This video presents how to attach a well known real time benchmark program - cyclictest. Once the process is attached we get a huge jitter.
I believe the only way to get information from an executing real time program, is by embedding some sort of cli into it ( example libcli ).
I believe the only way to get information from an executing real time program, is by embedding some sort of cli into it ( example libcli ).
 0:03:41
gdb debugger attach to a real time process in non stop mode
 0:07:29
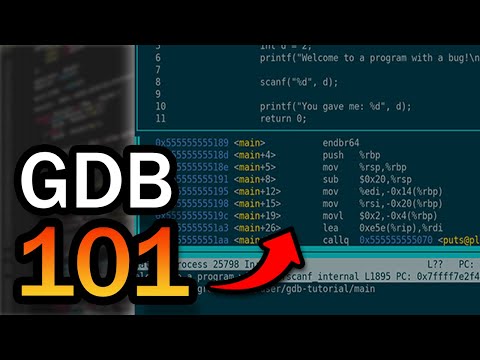
GDB is REALLY easy! Find Bugs in Your Code with Only A Few Commands
 0:06:33
Attaching GDB to a running program
 0:04:17
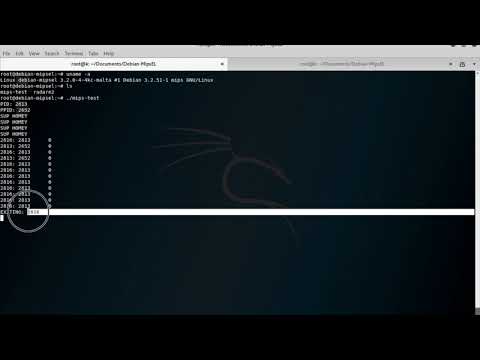
Debugging and Attaching to MIPS With GDB-MULTIARCH
 0:04:48
gdb debugging on running process
 0:07:15
ESP32 Technical Tutorials: Attaching GDB for debugging
 0:02:33
gdb remote live debugging - Video tutorial
 0:00:36
Visual Studio how to attach debugger to process|Visual Studio 2022 how to attach debugger to process
 0:08:07
Multiprocess debugging in GDB
 0:13:51
Debugging Embedded Systems With GDB?
 0:55:12
GDB Tutorial
 0:12:19
Debug Running Python Processes with GDB
 0:08:15
getting a python stacktrace from gdb! (intermediate - advanced) anthony explains #410
 0:05:13
How to use gdb debugger in raspberry pi for ARM assembly programs
 0:01:12
Attach debugger to a running Node process in VS Code (4/5 - Debugging in VS Code)
 0:06:51
Debugging an AVR controller under Linux with GDB and AVaRICE
 0:07:14
GDB Native Debugging and Patching With AppUse
 0:05:14
C Programming gdb Part 7 Debugging core files
 0:11:52
Cross Debugging with GDB: Embedded Linux
 0:11:44
How to Make an OS Supplemental Tutorial: Attaching gdb and VSCode
 0:54:26
Advanced Debugging with GDB
 0:43:02
GDB Basics
 0:05:30
Debugging with Multiple Threads (gdb, pthreads)
 0:32:08
Debugging with GDB (GNU Debugger)
Комментарии