filmov
tv
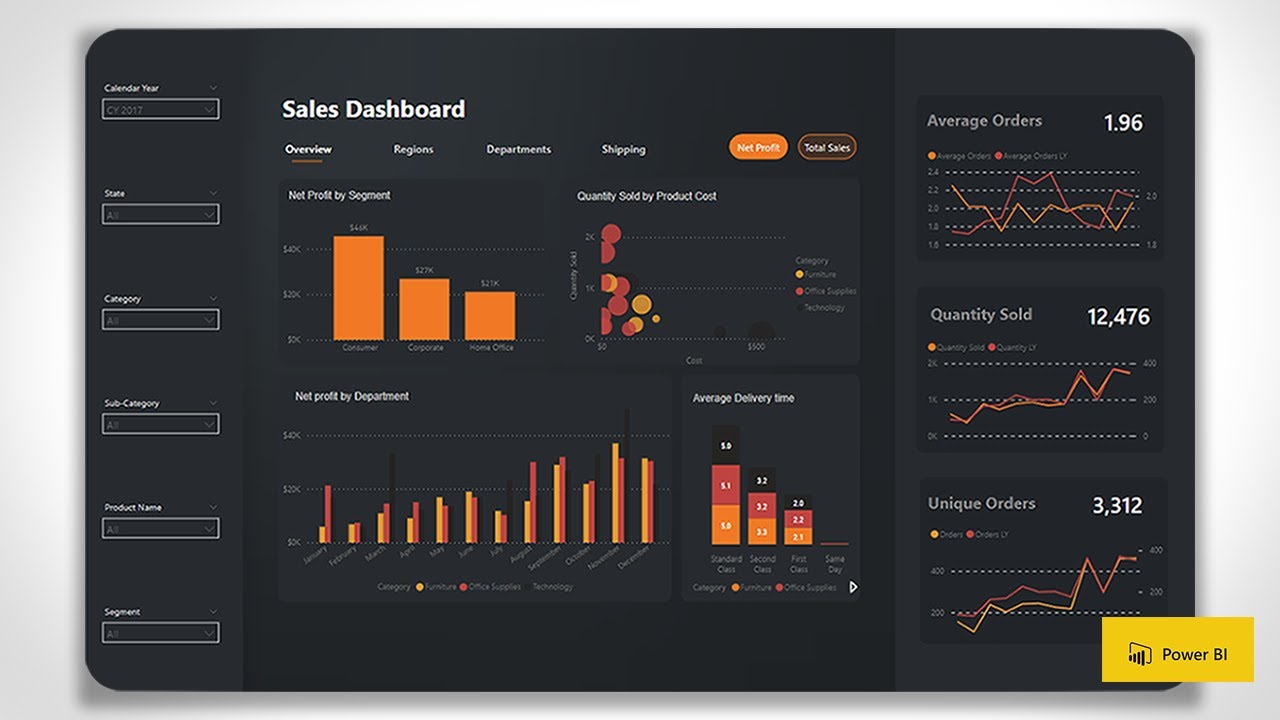
How to Build a STUNNING Sales Dashboard in Power BI - Tutorial #2022
Показать описание
In this video I will cover how to recreate this stunning dashboard. You will find you can build this all within Power BI using a basic colour palette and some design creativity.
Colour codes:
- Background & Inner panel visual boxes (Right hand side) #212529
- Side Panels - #272b2f
- Inside Panels - #212529
- Orange - #F17925
- Red - #BF4340
- Black - #252423
Video Timestamps:
0:00 Introduction
1:18: Setting up the report
2:10: Create Background
6:15: Exporting Background as Image
6:45: Placing image as Background
7:53: Page navigation
9:23: Headers
12:55: Visual design
-
-
-
-
-
-
-
-
Search Tags: Microsoft PowerBI, Microsoft Power BI, PowerBI, Power BI, PowerBI for Desktop, PowerBI Pro, PowerBI Online, PowerBI Tutorial, Power BI Tutorial, The Best PowerBI Design, Inspiring and Amazing PowerBI Design, PowerBI Dashboard, PowerBI Data Visualization, Power BI Data Analytics, Power BI Analysis, PowerBI Report and Dashboard Design, Easy PowerBI Design, Easy PowerBI Data Visualization, Easy PowerBI Tutorial, Power BI End to End Tutorial, PowerBI End to End Design, Quick and Easy, Power BI Tutorial From Beginner to Pro Desktop to Dashboard, PowerBI Data Modeling, PowerBI Measures, What is PowerBI, How to use PowerBI, Is PowerBI easy to learn, PowerBI vs Tableau, PowerBI Online vs Tableau Online, Power BI Tutorial for Beginners - Basics and Beyond, Power BI Tutorial for Beginners - Getting Started, Creating a Power BI report in under 5 mins, Analyze & Visualize Data with Power BI, Mastering Microsoft Power BI - Introduction to Power BI, Power BI Tutorial For Beginners | Introduction to Power BI, PowerBI Navigator, PowerBI Navigation, Data modelling in Power BI Desktop, Power BI Tutorial Videos, Power BI Advanced Tutorial, PowerBI for Freelancers, Power BI Slicers vs Filters, Drilling into drillthrough in Power BI Desktop, Power BI - Dashboards vs. Reports, Power BI Bookmarks, Selections and Toggles, Power BI Beginner Tutorial, How to build Power BI Dashboards, Design, Publish and Share a Sales Dashboard in Power BI, Power BI Desktop for Beginners: Create your first Power BI report and dashboard in 10 minutes, PowerBI For Newbies, PowerBI Ninja Tutorial, How to Design Visually Stunning Power BI Reports, PowerBI Basic Dashboard and Design, Microsoft Power BI: Building spectacular Power BI dashboards, PowerBI Infograph, Easily create infographics in Power BI with infographics desginer, Power BI Dashboard & Reports - Sales Analysis, Top 5 DAX tricks for super effective Power BI dashboards, Power BI visualization best practices, How to create PowerBI Dashboard Reports, Top 10 Most Effective Power BI Dashboard Tips & Tricks In, Design, Publish and Share a Sales Dashboard in Power BI, Power BI - Dashboards vs. Reports, How to Create Beautiful Power BI Dashboards Using the Power Pattern, PowerBI Tips & Tricks for Stunning Power BI Reports!, Power BI Dashboard & Reports - Inventory Analysis, PowerBI for Sales and Marketing, PowerBI for Supply Chain, PowerBI for Inventory, PowerBI for Supply Chain, PowerBI for Purchasing, PowerBI for Warehouse, PowerBI for Logistics, PowerBI for HR, PowerBI for Team Performance and Dashboard, PowerBI for Managers, PowerBI for Employees Team Performance, PowerBI for Excel Users, PowerBI PowerPivot, Import Data to PowerBI, PowerBI to Stores, The Best PowerBI Design, Build Top Amazing PowerBI Design, How to Design Visually Stunning Power BI Reports, Power BI Report Design Tips And Inspiration, Design a Navigation Panel - Power BI Desktop, Power BI Tutorial | Creating Landing Page using Dashboard and Tiles, Power BI Custom Visuals - Infographic Designer, Basic Dashboard in PowerBI, The Best PowerBI, PowerBI Design, Microsoft PowerBI, Free PowerBI Design and Downloads, Free download PowerBI PBIX File, The Microsoft PowerBI Desktop, Power BI App Navigation, Designing Impactful Reports in Power BI (Free Webinar), Free Download, Free Design, PowerBI Template and pbix, Power BI - Do it Yourself Tutorial - Dashboard Design, Create a custom KPI Card in a Power BI report, Introduction to Power BI Designer, 7 Worst Power BI Dashboard Mistakes & How to Avoid Them [PBIX examples included], Data Modeling with Power BI and Power Query, PowerBI M Language, PowerBI Best Practices, PowerBI Desktop, User and Developer, Visually appealing powerbi, PowerBI Trending
 0:01:23
This Build is Stunning! | Diablo 4 [Ep 14]
 0:53:33
How to Build the Great Pyramid in 9 Months (NOT aliens)
 0:08:07
DIY - How To Build Beautiful Villa And Swimming Pools With ASMR Magnetic Balls
 0:16:46
How to build a 'STUNNING' Pergola in ONE Weekend!
 0:09:13
YOU Can BUILD This STUNNING Raised Planter Box // DIY Woodworking
 0:10:29
Why We Don't Build 'Beautiful' Buildings Anymore
 0:23:59
How to build a beautiful wooden house. Amazing woodworkers teamwork!
 0:07:03
How to Build Great Teams | Jocko Willink & Dr. Andrew Huberman
 0:01:00
Let's Build a Great CommunityTogether!
 0:21:16
Amazing Building Skills! Build The Most Beautiful Underground Swimming Pool and Underground House
 0:03:57
Build a great TEAM - Steve Jobs Rule #5 of 10
 0:03:06
How to build great software | Travis Oliphant and Lex Fridman
 0:46:07
How to Build a Beautiful Cedar Strip Kayak with Kumiko Deck
 0:07:07
How I Would Build The Great Pyramids
 0:20:19
How to Build a STUNNING Sales Dashboard in Power BI - Tutorial #2022
 0:12:31
How to Build A Beautiful Waterfall Aquarium Very Easy \ For Your Family Garden
 0:30:30
How to Build Great Soil - A Soil Science Masterclass with Dr. Elaine Ingham (Part 1 of 4)
 1:07:29
Steve Blank: How to Build a Great Company, Step by Step | 8.14.12
 0:12:46
This Town PROVES We Can Still Build Beautiful Cities
 0:12:16
7 Ways To Build More Beautiful Cities
 0:43:16
The Most Beautiful Survival Bamboo Villa by Girl Build
 0:21:18
How to Build a Great Sales team
 0:00:41
How to Build a Stunning Water Slide in Minecraft! 🌊🛷
 0:15:57
Girl Living Off the Grid, Build The Most Beautiful Bamboo House Near My Village
Комментарии