filmov
tv
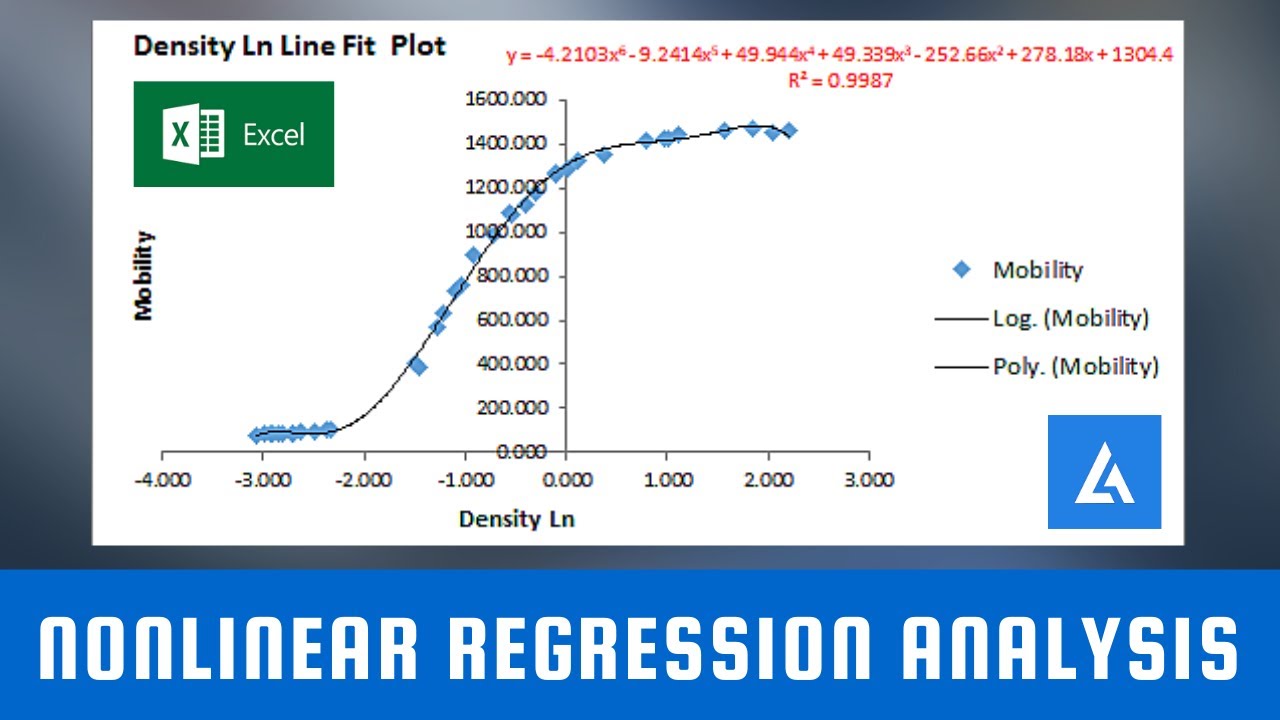
Nonlinear Regression Analysis: illustration with Example in Excel
Показать описание
Hello Friends,
This video is mainly focused on Regression analysis, its types, and Nonlinear Regression in very detail along with a practical example.
Nonlinear Regression analysis is used to mathematically describe the nonlinear relationship between a response variable and one or more predictor variables. Specifically, use nonlinear regression instead of “ordinary least squares regression” when you cannot adequately model the relationship with linear parameters.
I am going to explain this tool with a practical example for easy understanding and better clarity. This video contains the following topics:
1) What is Regression Analysis and its types?
2) Brief explanation of all types of Regression Analysis methods
3) When to use Nonlinear Regression Analysis?
4) Data considerations for Nonlinear Regression
5) Nonlinear Regression Analysis with Practical Example in Microsoft Excel
6) Interpretation of results from Regression analysis including R-Square, Significance F and p-values, Coefficients, Residuals and Best Fit Model for Nonlinear Regression
I am sure, you will like it. Please add your valuable comments and tell me where you are using these tools & techniques and your experiences during practical application.
You can also visit our Learning Management System (LMS) 📚📖📑 to access online courses at:
And finally, thank you for watching…
0:00 Introduction
0:26 What is Regression analysis and its types
0:53 Ordinary Least Square Regression (OLS)
1:34 Nonlinear Regression
1:47 Orthogonal regression
2:06 Partial Least Square Regression
2:55 Logistic Regression
3:43 What is nonlinear regression analysis
4:28 Data considerations for nonlinear regression
6:05 Nonlinear regression analysis with example in Excel
7:29 Interpretation of nonlinear regression
9:36 Best Fit Model
#nonlinearregression #nonlinearregressionexcel #regressionexcelexample #regressionanlysis #sixsigma #leansixsigma #statistics
 0:11:56
Nonlinear Regression Analysis: illustration with Example in Excel
 0:19:15
Nonlinear regression - the basics
 0:21:22
REGRESSION: Non-Linear relationships & Logarithms
 0:27:24
Lec 32: Nonlinear regression
 0:00:17
Artificial neural network curve fitting / nonlinear regression
 0:18:45
Multiple Regression Non Linear Variables
 0:14:22
Python 🐍 Nonlinear Regression Curve Fit
 0:27:52
Topic 5b -- Nonlinear regression
 1:05:35
A Perfect Fit: Finding Exact Versus Approximate Models
 0:15:31
Lecture -- Nonlinear Regression
 0:12:27
Linear Least Squares to Solve Nonlinear Problems
 0:02:34
Linear Regression in 2 minutes
 0:06:37
Non Linear Regression - Machine Learning | Beginner to Professional | Code Fantasy
 0:08:58
Introduction to Nonlinear Regression
 0:09:38
Regression Analysis: An introduction to Linear and Logistic Regression
 0:14:50
Dealing with nonlinear data: Polynomial regression and log transformations
 0:08:11
Multiple non-linear regression (MNLR) in QSAR studies using XLATST
 0:21:47
Linear and nonlinear Regression
 0:13:49
A Quick Introduction to Nonlinear Regression
 0:24:04
Linear and Nonlinear Regression in Python
 0:09:14
Nonlinear Regression in Microsoft Excel
 0:12:02
SPSS - Nonlinear Regression
 0:28:14
Example of non linear regression dose response data in GraphPad Prism
 0:13:58
Nonlinear regression - comparing models with F test and AIC | parameter correlation
Комментарии