filmov
tv
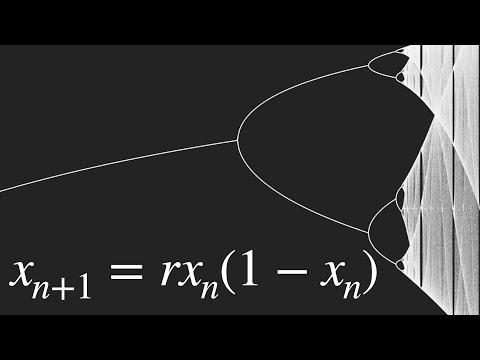
Logistic Map: Bifurcation Diagram from the movement of the initial points towards the attractors

Показать описание
iterating the Logistic Map Equation on the initial points (r0, x0), where r0 ranges from 0 to 4 and x0 ranges from 0 to 1, gives rise to the Bifurcation Diagram as the points get drawn towards the "attractors".
 0:18:39
 0:05:48
 0:02:07
 0:00:41
 0:00:31
 0:24:01
 0:06:21
 0:00:37
 0:03:54
 0:00:30
 0:00:37
 0:08:09
 0:16:29
 0:00:35
 0:01:00
 0:01:00
 0:00:36
 0:00:51
 0:00:13
 0:03:55
 0:03:42
 0:32:21
 0:20:35
 0:17:18