filmov
tv
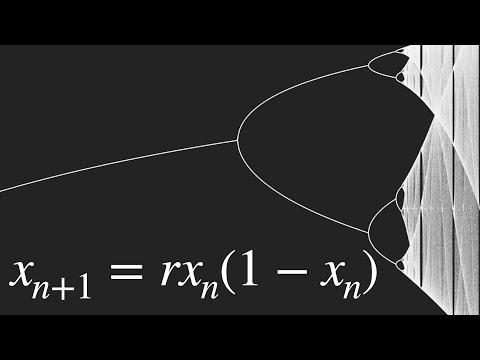
Matlab code for the Bifurcation Diagram of the Logistic Map

Показать описание
An instructional video on how to generate the bifurcation diagram in Matlab.
Reference: Moysis, L., Lawnik, M., & Volos, C. (2023). Density-Colored Bifurcation Diagrams—A Complementary Tool for Chaotic Map Analysis. International Journal of Bifurcation and Chaos, 33(15), 2330036.
Papers on bifurcation diagrams:
#chaos #chaostheory #nonlinear #attractor #strangeattractor #nonlineardynamics #lorenz #bifurcation #physics #stem #mathematics #matlab #butterflyeffect #differentialequation #dynamics #dynamicalsystems #χάος #φυσική #μαθηματικά #education #phasediagram #phaseportrait #chaotic #cobweb #physicseducation #science #physicseducation
 0:06:21
Matlab code for the Bifurcation Diagram of the Logistic Map
 0:12:39
Matlab code for the Bifurcation Diagram of the Lorenz Chaotic System
 0:06:23
MATC58 Lec 2.7b: bifurcations and plotting
 0:16:29
Simulating the Logistic Map in Matlab
 0:00:31
Bifurcation diagram of a logistic Map
 0:00:23
Pitchfork Bifurcation
 0:18:39
This equation will change how you see the world (the logistic map)
 0:09:32
coding phase space poincare section and bifurcation plots
 0:23:06
Plot in MATLAB Phase Portraits and State-Space Trajectories of Dynamical Systems
 0:01:00
Logistic Map Bifurcation Diagram (An Introduction)
 0:03:12
412 28 Numerical Continuation with Matcont: Hopf Bifurcation and Period Doubling
 0:17:16
Explaining Density-Colored Bifurcation Diagrams for Chaotic Systems (Matlab)
 0:13:56
NCS - 03a - Bifurcation and Chaos in Nonlinear Systems
 0:01:35
Period-doubling bifurcation
 0:03:54
Bifurcation diagram of Logistic map || Python
 0:01:01
bifurcation diagram with density #physics #science #chaos #chaostheory #matlab
 0:10:07
MATCONT :-Saddle Node Bifurcation(1-D)
 0:37:17
Lecture 11: Bifurcation: Transcritical bifurcation
 0:04:27
Logistic chaotic map - Matlab code
 0:05:48
The Logistic Map: Attractors, Bifurcation, and Chaos (Part 1 of 2)
 0:00:41
Bifurcation diagram of the Logistic map.
 0:09:51
Lecture 03: 1 of 3 MATLAB code for Fractal Fractional Numerical Scheme in the Caputo Sense
 0:16:38
Automatic Numerical Bifurcation Analysis with Applications to Neurosciences with BifurcationKit
 0:24:01
Explaining the Bifurcation Diagram for the Logistic Map
Комментарии