filmov
tv
Cumulative Frequency and Probability Table in R (Examples) | Count & Sum | table & cumsum Functions

Показать описание
R code of this video:
x <- sample(LETTERS[1:4], 100, TRUE)
head(x) # First six values of example data
table_x <- table(x) # Create frequency table
table_x # Print frequency table
cumsum_table_x <- cumsum(table_x) # Create cumulative frequency table
cumsum_table_x # Print cumulative frequency table
rownames(data_freq) <- LETTERS[1:4]
data_freq # Print data frame with relevant values
Follow me on Social Media:
 0:05:04
How To Make a Cumulative Relative Frequency Table
 0:00:40
How to find Cumulative frequency in easy way using Running Total #excelvideo #microsoftexcel #excel
 0:01:04
Finding Cumulative Frequency | Statistics
 0:11:46
Cumulative Frequency Diagrams - GCSE Higher Maths
 0:25:11
Understand Frequency Tables, Cumulative & Relative Frequency in Statistics - [7-7-3]
 0:00:13
Calculate Cumulative frequency #prowess #maths #shortsfeed #frequency #cumulative #payalnayak
 0:05:21
Normal Distribution: Calculating Probabilities/Areas (z-table)
 0:02:34
How To Find Probability From Cumulative Frequency Graph? - The Friendly Statistician
 0:40:44
Statistics: for XI Standard & IIT-JEE - 11/11
 0:01:44
Cumulative Frequency Formula in Excel | Create a Cumulative Frequency Distribution Table
 0:01:38
How To Construct And Calculate A Cumulative Frequency Distribution Table - What is Cumulative?
 0:00:15
How to Find the Class Boundaries in Statistics | Frequency Distribution Business Statistics
 0:05:34
Find the Relative Frequency Cumulative Frequency and Midpoint
 0:05:48
What is a cumulative frequency. How to construct a cumulative frequency distribution table.
 0:02:24
Cumulative frequency table (Statistics)
 0:11:05
How to Make a Grouped Frequency Table (Grouped Frequency Distribution Table) | Math with Mr. J
 0:11:02
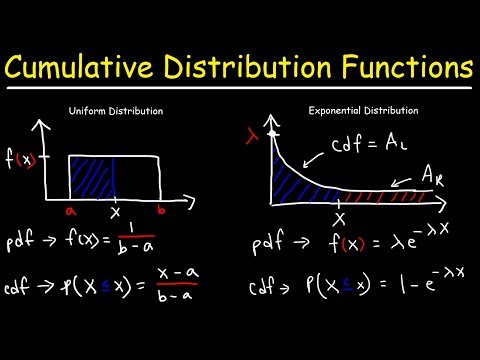
Cumulative Distribution Functions and Probability Density Functions
 0:17:53
Cumulative Frequency
 0:00:23
calculating median from frequency table using a #scientificcalculator #igcsemath
 0:00:49
What is cumulative frequency//#shorts//Statistics
 0:14:34
Mean, Median, and Mode of Grouped Data & Frequency Distribution Tables Statistics
 0:10:10
Lesson 2.1 Frequency Table, Tally, Midpoint, Relative Frequency and Cumulative Frequency
 0:04:07
Cumulative Frequency and Probability Table in R (Examples) | Count & Sum | table & cumsum Fu...
 0:05:09
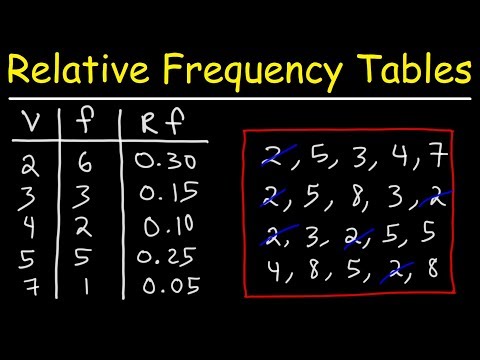
How To Make a Relative Frequency Distribution Table
Комментарии