filmov
tv
3D visualization of the Riemann Zeta Function using python matplotlib

Показать описание
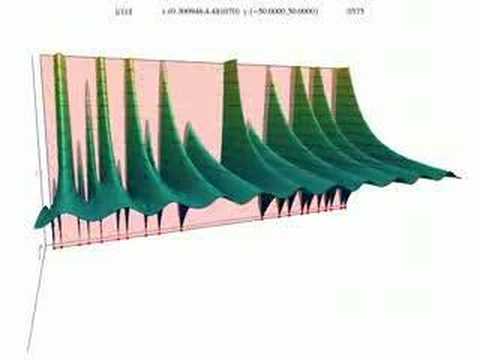
3D visualization of the Riemann Zeta Function using python matplotlib.
Some interesting features of the Riemann Zeta "landscape" are highlighted in this animation.
The complex input variable s is represented in the rectangular form, while the output ζ(s) is represented using the polar form.
The value of the output |ζ(s)| is limited to 5 to avoid messing the plot around singularities.
Negative arguments of the output arg(ζ(s)) is always converted to positive angles for better color mapping. (ex.: -10° is modified to 350°)
Please enjoy.
 0:03:14
3D visualization of the Riemann Zeta Function using python matplotlib
 0:22:11
But what is the Riemann zeta function? Visualizing analytic continuation
 0:00:38
Riemann Sum Animation!
 0:00:50
Riemann Integral Visualization
 0:14:32
The 5 ways to visualize complex functions | Essence of complex analysis #3
 0:00:19
Visualize 3D Riemann Sums | New in Mathematica 8 | Mathematica
 0:01:07
Riemann Hypothesis visualised
 0:04:37
Riemann Hypothesis and zeta function interesting visualization on x-axis #SoME3
 0:04:00
3D Rectangular Riemann Sum (360°)
![[Visual] The Riemann](https://i.ytimg.com/vi/GcbML8bGSu8/hqdefault.jpg) 0:08:41
0:08:41
[Visual] The Riemann Zeta Function Visualised
 0:00:47
Riemann zeta function
 0:06:14
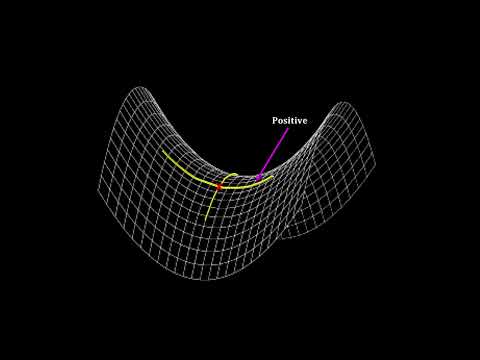
Classroom Aid - Riemannian Curvature Tensor
 0:03:21
Neo-Riemannian Theory Explained In 3 Minutes
 0:00:26
Making of the Riemann surface for w=sqrt(z)
 0:01:41
Riemann Zeta function visualization for s=1/2. From imaginary zero to 100.
 0:04:49
Exploring other dimensions - Alex Rosenthal and George Zaidan
 0:22:21
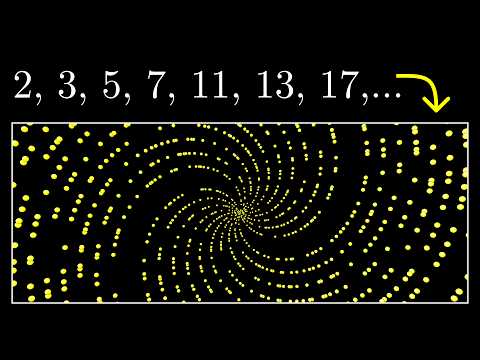
Why do prime numbers make these spirals? | Dirichlet’s theorem and pi approximations
 0:02:13
Riemann Sum in 3D
 0:01:16
Visualizing Integrals
 0:03:06
What is Neo-Riemannian Music Theory?
 0:01:25
Sphere surface area proof sketch
 0:08:27
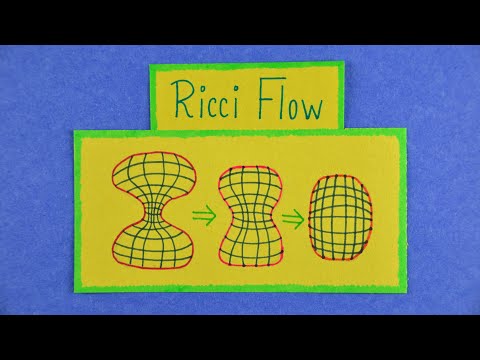
Poincare Conjecture and Ricci Flow | A Million Dollar Problem in Topology
 0:09:41
Defining Double Integration with Riemann Sums | Volume under a Surface
 0:00:27
Euler's Formula in 3D! 🌀✨️ #math #animation #mathtutoring #matheducation #mathematics
Комментарии