filmov
tv
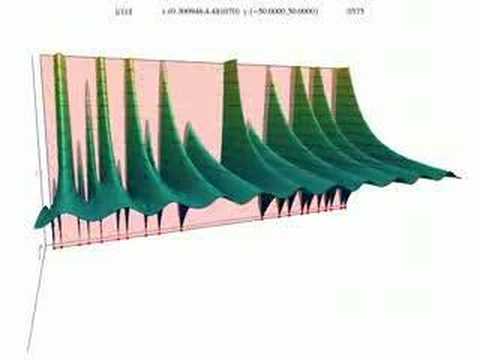
Riemann Zeta function visualization for s=1/2. From imaginary zero to 100.

Показать описание
I used the averaging method of Isaac Mor to find the (Cesaro-like?) limit of the Zeta function at Re(s)=1/2; the critical strip. The colors go from red (the actual values of the RZ function), via blue (averages of all red points), to green (averages of all blue points). You can see the 'dance' around zero, but also notice the fact that a single run of the Zeta function really consists of two parts: a spiral (whose centerpoint is the value of the Zeta function), and an 'arm', that moves to the center of the spiral from 1.
 0:22:11
But what is the Riemann zeta function? Visualizing analytic continuation
![[Visual] The Riemann](https://i.ytimg.com/vi/GcbML8bGSu8/hqdefault.jpg) 0:08:41
0:08:41
[Visual] The Riemann Zeta Function Visualised
 0:00:14
Riemann Zeta Function Animation
 0:16:24
The Riemann Hypothesis, Explained
 0:01:01
The 4765th Loop of the Riemann Zeta Function Is Itty Bitty
 0:01:41
Riemann Zeta function visualization for s=1/2. From imaginary zero to 100.
 0:28:33
What is the Riemann Hypothesis REALLY about?
 0:04:37
Riemann Hypothesis and zeta function interesting visualization on x-axis #SoME3
 0:29:57
The Riemann Hypothesis
 0:00:47
Riemann zeta function
 0:06:05
Grant Sanderson (3Blue1Brown): Euler Product Formula and the Riemann Zeta-Function
 0:12:38
The Key to the Riemann Hypothesis - Numberphile
 0:00:38
Why greatest Mathematicians are not trying to prove Riemann Hypothesis? || #short #terencetao #maths
 0:00:59
Math is BROKEN: 1x2x3x...= √2π
 0:01:07
Riemann Hypothesis visualised
 0:17:43
The Riemann Hypothesis - Picturing The Zeta Function
 0:00:37
Riemann zeta function, real and imaginary graphs with non-trivial zeros
 0:14:43
Exploring the Riemann Zeta Function and the Riemann Hypothesis
 0:15:23
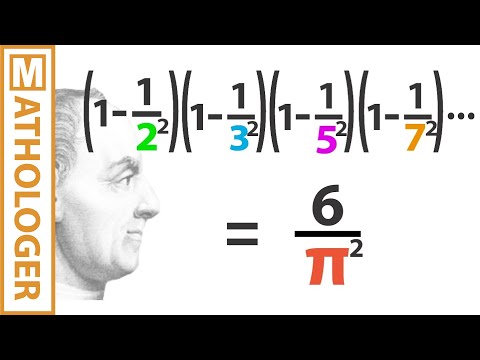
Euler’s Pi Prime Product and Riemann’s Zeta Function
 0:01:00
Nontrivial Zeros of Riemann Zeta Function
 0:16:27
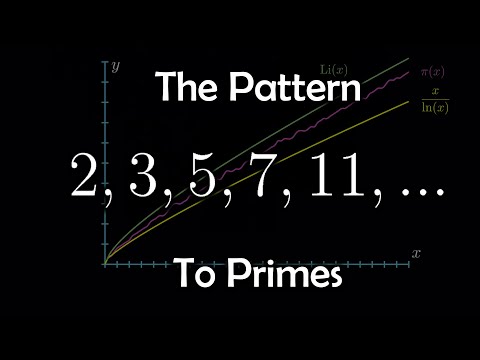
The Pattern to Prime Numbers?
 0:49:34
Analytic Continuation and the Zeta Function
 0:00:16
Riemann Zeta function explained
 0:01:24
Riemann zeta function critical strip visualization
Комментарии