filmov
tv
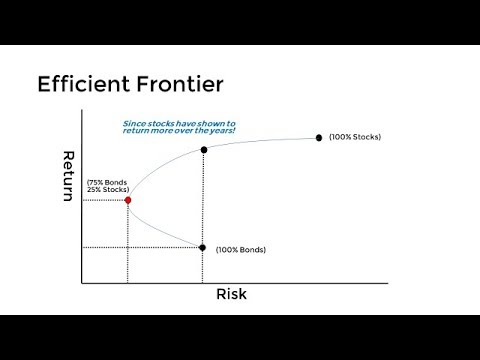
Efficient Frontier in Python p.1

Показать описание
Part 1: Building the Efficient Frontier in Python
In this series we are building the Efficient Frontier in Python with Dash as a web application over multiple tutorials.
★ ★ QuantPy GitHub ★ ★
★ ★ Discord Community ★ ★
★ ★ Support our Patreon Community ★ ★
Get access to Jupyter Notebooks that can run in the browser without downloading python.
★ ★ ThetaData API ★ ★
ThetaData's API provides both realtime and historical options data for end-of-day, and intraday trades and quotes. Use coupon 'QPY1' to receive 20% off on your first month.
★ ★ Online Quant Tutorials ★ ★
★ ★ Contact Us ★ ★
Disclaimer: All ideas, opinions, recommendations and/or forecasts, expressed or implied in this content, are for informational and educational purposes only and should not be construed as financial product advice or an inducement or instruction to invest, trade, and/or speculate in the markets. Any action or refraining from action; investments, trades, and/or speculations made in light of the ideas, opinions, and/or forecasts, expressed or implied in this content, are committed at your own risk an consequence, financial or otherwise. As an affiliate of ThetaData, QuantPy Pty Ltd is compensated for any purchases made through the link provided in this description.
 0:16:22
Efficient Frontier in Python p.1
 0:18:00
Efficient Frontier in Python p.2
 0:05:36
Py 85 Obtaining the Efficient Frontier in Python Part I
 0:10:06
How to make an Efficient Frontier Using Python
 0:06:48
Efficient Frontier Python
 0:28:57
Efficient Frontier in Python p.4
 0:07:30
Efficient Frontier in Python p.3
 0:27:08
Efficient portfolio frontier in Python
 0:16:58
Efficient Frontier in Python p.5
 0:25:17
Modern portfolio theory in Python: Efficient Frontier and minimum-variance portfolio
 0:07:42
How to construct an efficient frontier of risky assets in Python?
 0:08:47
Graph The Efficient Frontier And Capital Allocation Line In Excel
 0:06:50
Markowitz Bullet in Python (Code Tutorial) | Efficient Frontier
 0:33:58
Stock Market Analysis & Markowitz Efficient Frontier on Python | Python # 11
 0:10:16
How to build an Efficient Portfolio Frontier in Python with 3 stocks
 0:03:05
The Efficient Frontier - Explained in 3 Minutes
 0:23:07
Portfolio Optimization in Python: Boost Your Financial Performance
 0:03:41
Plotting the Minimum Variance Portfolio in Python
 0:33:18
Modern Portfolio Theory PYTHON [Efficient Frontier Portfolio] 2020
 0:32:47
Use Excel to graph the efficient frontier of a three security portfolio
 0:14:24
Markowitz portfolio optimization - Python
 0:03:40
'EFFICIENT FRONTIER' Defined and Explained
 0:02:08
Py 87 Obtaining the Efficient Frontier in Python Part III
 0:05:20
Efficient frontier in python p 3
Комментарии