filmov
tv
Excel Data Visualization Course | Data Visualization Excel Full Course | Excel | Simplilearn

Показать описание
This video by simplilearn is based on excel data visualisation course. Excel data visualization involves transforming raw data into graphical representations like charts, graphs, and dashboards. These visual tools help identify trends, patterns, and outliers, making complex datasets easier to understand. Here are the topics covered
[00:06 - 00:11] Course Introduction to Excel
[00:11 - 00:17] How to Subscribe and Support the Channel
[01:52 - 01:59] What is Data Visualization?
[02:56 - 03:02] Importance of Visualization for Decision-Making
[06:11 - 06:16] Defining Data Visualization
[09:34 - 09:40] Exploring Line Charts in Excel
[12:26 - 12:32] Analyzing Bar Charts
[18:05 - 18:12] Creating Map Charts for Data
[25:01 - 25:09] Data Transformation in Excel
[36:02 - 36:08] Conclusion and Next Session
-- Frequently Asked Questions
✅ Question 1) Can Excel be used for data visualization?
Answer: Data visualization in Excel refers to the graphical representation of data using various charts, graphs, and other visual elements.
✅ Question 2) What is the best visualization tool for Excel?
Answer: The Best Data Visualization Software of 2024.
1. Microsoft Power BI.
2. Tableau.
3. Qlik Sense.
✅ Question 3) How to make Excel data visually appealing?
Answer: How to format an Excel spreadsheet to look professional.
1. Align text left or right. It's tempting to center the text in some cells, particularly those that serve as headers. ...
2. Leave the first row and column empty.
3. Remove cell borders.
4. Limit colors in your Excel spreadsheet.
5. Share your Excel spreadsheets as PDF files.
#dailyactivitytrackerinexcel #dailytasktrackerinexcel #dailyactivityreportinexcel #howtomakedailyactivitytrackerinexcel #dailyactivitytrackerinexceland #dailyactivitytrackerinexcel, simplilearn, #2024
➡️ About Post Graduate Program In Data Analytics
This Data Analytics Program is ideal for all working professionals and prior programming knowledge is not required. It covers topics like data analysis, data visualization, regression techniques, and supervised learning in-depth via our applied learning model with live sessions by leading practitioners and industry projects.
✅ Key Features
- Post Graduate Program certificate and Alumni Association membership
- Exclusive hackathons and Ask me Anything sessions by IBM
- 8X higher live interaction in live online classes by industry experts
- Capstone from 3 domains and 14+ Data Analytics Projects with Industry datasets from Google PlayStore, Lyft, World Bank etc.
- Master Classes delivered by Purdue faculty and IBM experts
- Simplilearn's JobAssist helps you get noticed by top hiring companies
- Resume preparation and LinkedIn profile building
- 1:1 mock interview
- Career accelerator webinars
✅ Skills Covered
- Data Analytics
- Statistical Analysis using Excel
- Data Analysis Python and R
- Data Visualization Tableau and Power BI
- Linear and logistic regression modules
- Clustering using kmeans
- Supervised Learning
🔥🔥 *Interested in Attending Live Classes? Call Us:* IN - 18002127688 / US - +18445327688
 1:10:23
Excel Data Visualization Course – Guide to Charts & Dashboards
 7:11:45
Excel Data Analysis Full Course Tutorial (7+ Hours)
 4:11:47
Excel Data Analytics Full Course | Essential Skills For Data Analysis In Excel | Simplilearn
 0:38:40
Excel Data Visualization Course | Data Visualization Excel Full Course | Excel | Simplilearn
 1:53:40
Introduction to Data Analysis with Excel: 2-Hour Training Tutorial
 0:04:48
7 Data Visualization Tricks on Excel - Tutorial
 0:00:41
Top Excel courses for Data Analysts 🧑🎓📊
 0:00:00
Interactive Excel Charts and Dashboards - Data Visualization Course
 0:08:31
Data Cleaning & Meta Analysis Using Free AI! All Excel Works Using Bricks AI For Free| AI For Ex...
 0:00:38
How I use Excel as a Data Analyst 📊🤓
 0:08:16
I started my data analyst career taking these beginner courses
 0:25:57
Data Visualization Crash Course | Consulting Best Practices
 0:49:16
Beginner to Pro FREE Excel Data Analysis Course
 0:19:21
📊 How to Build Excel Interactive Dashboards
 0:14:10
Excel Charts & Graphs: Learn the Basics for a Quick Start
 0:37:16
Full Project in Excel with Interactive Dashboard | Excel Tutorial for Beginners
 0:13:53
Data Analysis Project in Excel (3-Step Framework)
 0:40:50
Full Project in Excel | Excel Tutorials for Beginners
 0:00:41
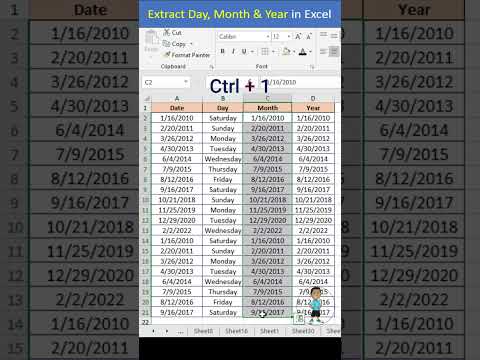
Excel Interview Question Day Month Year in Excel #excel #exceltips #exceltutorial #msexcel #shorts
 0:10:59
How I Would Learn Data Analysis (If I Could Start Over in 2024)
 0:08:13
Excel AI - data analysis made easy
 0:00:48
How I'd Learn to Become a Data Analyst
 0:00:56
Data Visualization Hack: 10 Second Rule #shorts
 0:21:51
DATA VISUALIZATION In EXCEL | How To Build Interactive CHARTS In EXCEL | Simplilearn #excel #charts
Комментарии