filmov
tv
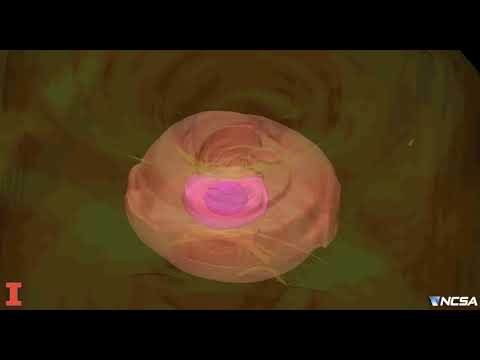
Numerical-relativistic simulation of a binary neutron star merger
Показать описание
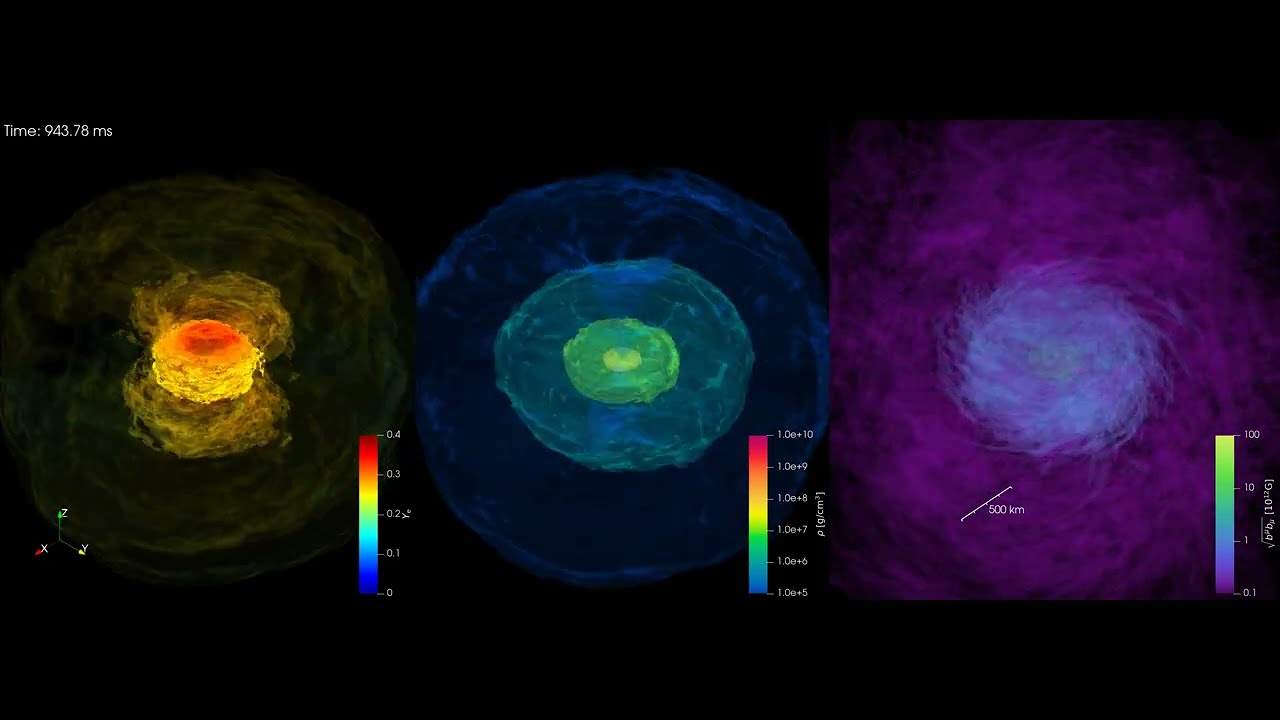
The visualization shows the numerical-relativistic simulation of a binary neutron star merger. The simulation was done on the Japanese supercomputer “Fugaku” and used about 72 million CPU hours (corresponding to 8200 CPU years) with 20,736 CPUs. The neutron stars have masses of 1.2 and 1.5 solar masses, respectively, which is consistent with the parameters of the merger observed in August 2017 (GW170817). The data was generated during a one second-long general-relativistic neutrino-radiation magnetohydrodynamic simulation. The visualization shows the electron fraction on the left, the density in the center, and the magnetic field strength (10^15 Gauss) on the right.
©K. Hayashi, K. Kiuchi (Max Planck Institute for Gravitational Physics & Kyoto University)
©K. Hayashi, K. Kiuchi (Max Planck Institute for Gravitational Physics & Kyoto University)
 0:00:47
Numerical-relativistic simulation of a binary neutron star merger
 0:00:48
GW170817: Numerical relativity simulation of a binary neutron star merger
 0:06:57
One second-long numerical-relativistic simulation of a binary neutron star merger
 0:00:16
Full Numerical Relativity Simulation of 2 Spinning Black Holes Inspiraling
 0:00:38
Numerical Relativity simulation compatible with first gravitational wave detection
 0:00:19
Simulation of a Neutron Star-Black Hole Binary Merger
 1:02:59
Numerical Relativity Simulations of Binary Neutron Star Mergers
 0:00:51
PNW Numerical Relativity Sample
![[W169] Rodrigo Nemmen:](https://i.ytimg.com/vi/rv9RKo2taMU/hqdefault.jpg) 0:55:46
0:55:46
[W169] Rodrigo Nemmen: Supermassive binary black holes and their electromagnetic counterparts
 0:01:01
My first attempt into Numerical Relativity simulations
 0:00:41
General-Relativistic Hydrodynamics Simulation of a Neutron Star -- Sub-Solar-Mass Black Hole Merger
 0:01:21
Numerical Relativity on a GPU-based home computer - (trailer - no math no code version)
 0:01:17
Full 3D Numerical Relativity Simulation on a GPU Based Home Computer (trailer)
 0:01:00
Simulation of GW151226
 0:00:24
Simulation of the binary black-hole coalescence GW170104
 0:52:44
Harald Pfeiffer - Numerical relativity: Exploring new capabilities with binary black holes
 0:00:13
General Relativity Simulation
 0:02:04
General Relativistic Eccentric Binary Neutron Star Merger
 0:11:39
Numerical Relativity Surrogate model for eccentric binary black hole gravitational waveform
 0:00:52
PNW Numerical Relativity Sample 2
 0:02:09
NCSA Numerical Relativity Simulation of GW170817
 0:10:41
General Relativistic Simulations of Massive Binary Black-Hole Mergers in Magnetized Environments
 0:01:07
Simulation of an orbit in general relativity
 0:00:46
General relativity simulation
Комментарии