filmov
tv
Excel for HR: Market Benchmark Pay Report with Floating Bar Chart (Part 1)

Показать описание
New course Launched! I created it to show you step-by-step how to design a salary structure with regression analysis in Excel. Check out the detail here:
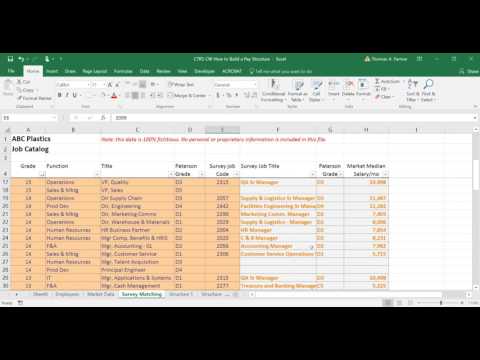
Chart Type: Clustered Column Chart
Business Scenario: You need to decide whether to increase pay level for a job (Business is complaining!).
You have the market data for 2 jobs and you want to visualize them for yourself and your clients.
In the next video, I will show you how to compare the market pay to internal employee pay and visualize them.
******Follow-up Consulting Services******
******Follow-up Consulting Services******
******More Videos in Playlists******
#ExcelforHR#HRAnalytics#Excel#HR
 0:15:12
Excel for HR: Market Benchmark Pay Report with Floating Bar Chart (Part 1)
 0:15:59
Excel for HR: Market Benchmark Pay Report with Floating Bar Chart (Part 3)
 0:13:13
Excel for HR: Market Benchmark Pay Report with Floating Bar Chart (Part 2)
 0:05:54
Excel for HR: Salary Structure Floating Bar Chart with Employee Data
 0:09:51
How to Interpret Salary Survey Data | Salary Benchmarking For Beginners
 0:15:18
How to evaluate and visualize an internal equity or pay compression issue?
 0:11:49
How to Build a Salary Structure with Simple Regressed Midpoints
 0:14:15
Critical HR Ratio Explained: What is Compa-ratio, Range Penetration and more
 0:07:43
How to make a Product Comparison Template in Excel (Benchmarking)
 0:12:29
How to Calculate Midpoint Formula for Salary Ranges, Compensation Analysis
 0:19:48
How to Pass Excel Assessment Test For Job Applications - Step by Step Tutorial with XLSX work files
 0:01:33
Benchmark sales by year on a dashboard report in Excel
 0:13:26
How to Create Salary Ranges For Different Grades | Payscale Overview
 0:02:23
How To Create a KPI Dashboard In Excel? [2022]
 0:06:54
Properly Calculate Percentile and Percentile RANK in Excel (INC vs EXC)
 0:30:37
How to build Dynamic & Interactive Dashboard in EXCEL with Pivot Tables&Charts | Tutorial Ep...
 0:58:44
Building a KPI-based HR Dashboard in Excel
 0:11:39
10X Your Excel Skills with ChatGPT 🚀
 0:58:26
Compensation Planning with HR Strategies Consulting
 0:02:57
Excel Benchmark for Traders by Exceltrader.net
 2:33:21
Compensation Benchmarking and Analysis
 0:04:35
Excel for HR: Salary Structure Floating Bar Chart with Customized X axis
 0:13:25
How to Create a Half Circle Radial Bar Chart and Save as Chart Template
 0:00:34
SmartScale on-line Salary and HR benchmark - short demo
Комментарии