filmov
tv
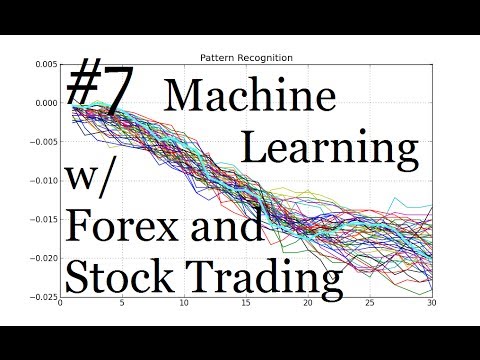
Current Pattern: Machine Learning for Algorithmic Trading in Forex and Stocks

Показать описание
In this video, we are are locating the latest pattern, in order to compare it to the previous ones for pattern recognition.
Welcome to the Machine Learning for Forex and Stock analysis and algorithmic trading tutorial series. In this series, you will be taught how to apply machine learning and pattern recognition principles to the field of stocks and forex.
This is especially useful for people interested in quantitative analysis and algo or high frequency trading. Even if you are not, the series will still be of great use to anyone interested in learning about machine learning and automatic pattern recognition, through a hands-on tutorial series.
 0:05:00
Current Pattern: Machine Learning for Algorithmic Trading in Forex and Stocks
 0:05:01
All Machine Learning Models Explained in 5 Minutes | Types of ML Models Basics
 0:07:52
Machine Learning | What Is Machine Learning? | Introduction To Machine Learning | 2024 | Simplilearn
 0:05:49
AI vs Machine Learning
 0:07:50
Machine Learning vs Deep Learning
 0:00:36
THIS is HARDEST MACHINE LEARNING model I've EVER coded
 0:00:26
I can't STOP reading these Machine Learning Books!
 0:02:11
Machine-Learning Systems Can Search for Visual Patterns in Price Charts
 0:23:36
Search Pattern (KMP-Algorithm) | GFG POTD 2nd dec 2024 | JAVA | C++
 0:00:28
Learning Machine Learning has never been easier #shorts #machinelearning #statistics #datascience
 0:01:00
Neural Networks explained in 60 seconds!
 3:53:53
Machine Learning for Everybody – Full Course
 0:10:01
AI, Machine Learning, Deep Learning and Generative AI Explained
 0:05:45
Neural Network In 5 Minutes | What Is A Neural Network? | How Neural Networks Work | Simplilearn
 0:18:40
But what is a neural network? | Deep learning chapter 1
 0:00:56
📚3 In-Depth Machine Learning Books You Can't Miss! #machinelearning #datascience #shorts
 0:00:44
How AI works: Machine learning
 0:11:30
Machine Learning for Pattern Recognition | Classifying Semiconductor Wafers with TIBCO Data Science
 0:04:32
Neural Networks Explained in 5 minutes
 0:48:12
Machine Learning Course - 23. ML Design Pattern - Ranking
 0:00:08
Here are the Salaries of Machine Learning Engineers at FAANG!
 0:23:09
Time Series Forecasting with XGBoost - Use python and machine learning to predict energy consumption
 1:53:12
The Elegant Math Behind Machine Learning
 0:28:02
New Advances in Artificial Intelligence and Machine Learning
Комментарии