filmov
tv
WinCC Unified V16: using the included debugger from the Browser to debug JavaScript for chrome V79

Показать описание
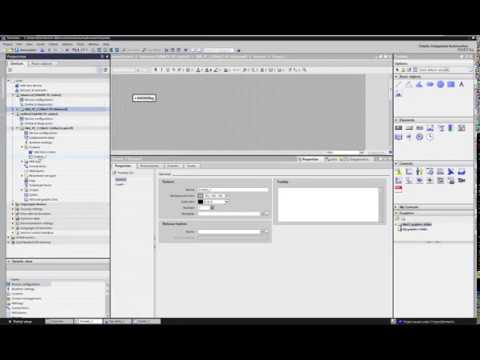
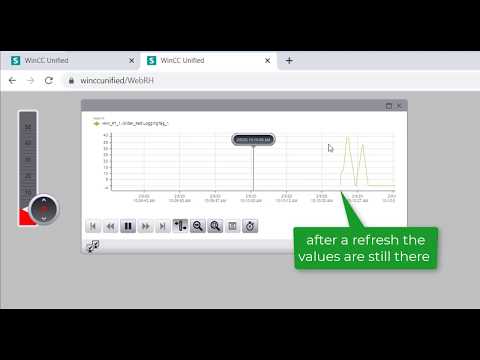
In this Video I show you how you activate the script debugging. And How you debug the JavaScript with break points. this way work for Chrome Browsers with a version smaller than V80.
#DerHecht #WinCC #Unified #TIAPortal
#DerHecht #WinCC #Unified #TIAPortal
WinCC Unified V16: use the media player to play a video
WinCC Unified V16: Units on the I/O field by using the Output format
WinCC Unified V16: use the Output format (format pattern)
WinCC Unified V16: how to connect the Unified Simulation with a S7-1500/1200 or S7-300/400 PLC
WinCC Unified V16: How to use the Parameter set control for recipe handling
WinCC Unified V16: use of a Global Module (Global Script) with a JavaScript function
WinCC Unified V16: Autostart of your project
WinCC Unified V16: use the browser control to display a .pdf file
WinCC Unified V16: display Historical data in a trend on a Unified Comfort Panel
WinCC Unified V16: multiplex array of UDT with index tag
WinCC Unified V16: Screen navigation Tutorial Part 1 with two screen windows and the FindItem method
WinCC Unified V16: first steps with Custom Web Controls part1
WinCC Unified V16: use the file-base data login and display the data in the Trend control
WinCC Unified V16: connect the Trend companien to the Trend control and use the Calculate statistics
WinCC Unified V16: different startscreen by user
WinCC Unified V16: create your own Screen buffer with JavaScript
WinCC Unified V16: Connect a Unified OPC UA Client to a OPC UA Server
WinCC Unified V16: add users to Runtime and add authorizations on the slider
WinCC Unified V16: How to configure a IPC with SoftPLC S7-1507S and Unified
WinCC Unified V16: Open Pipe first steps to subscribe a HMI tag with the JavaScript examples
TIA Portal V16 & WinCC Unified: first steps and start of the simulation
WinCC Unified V16: Difference between the PopUp Call WinCC Comfort/Advanced vs. WinCC Unified
WinCC Unified V16: Webserver Certificate Tutorial Part 1 with Computername
WinCC Unified V16: using the included debugger from the Browser to debug JavaScript for chrome V79
Комментарии
 0:02:02
 0:01:46
 0:01:34
 0:00:38
 0:07:18
 0:02:44
 0:01:44
 0:02:40
 0:02:06
 0:03:09
 0:05:04
 0:09:34
 0:04:22
 0:01:32
 0:01:46
 0:02:21
 0:03:12
 0:03:37
 0:02:18
 0:05:38
 0:03:49
 0:02:32
 0:05:04
 0:01:28