filmov
tv
2022 How to Load, Clean, and Visualize Raw CSV Data in MATLAB | MATLAB Tutorial

Показать описание
How to Import, Clean, and Visualize Raw .csv Data in MATLAB! Load the data, filter and clean arrays, and create plots and graphs of the raw data. Awesome beginner project!
1. Import or Load Raw Data into MATLAB
2. Convert Raw Data to Proper Datatypes
3. Perform String Manipulation on Strain Data
4. Create Visualizations, Optimize Visuals
LEARN MATLAB
CHAPTERS
0:00 Import / Load Data
2:33 Convert Tables to Arrays
5:28 String Manipulation
8:40 Cleaned Data!
9:30 Data Visualizations
9:55 3D Plot plot3()
10:43 Scatter Plot scatter()
15:09 Final Result
MATLAB BASICS
ADVANCED MATLAB
---------------------------------FREE CODE FROM VIDEO----------------------------------------------------------
% Plotting Sensor Data
% Read in Sensor Data
clc, clearvars, close all, format compact
% Load in Data
%% Data Filtering/Processing (MUST BE RUN AFTER SECTION 1)
clc, clearvars -except data, format compact, close all
% Convert x, y, and strain from Table to Array
strain(:,1) = table2array(data(:,1));
strain(:,2) = table2array(data(:,2));
s3 = table2array(data(:,3));
% Third Column is tricky
% cell to string... or char?
s3 = string(s3);
% Get rid of values right of !
s3 = split(s3,"!");
% Convert to double (numeric)
s3 = double(s3(:,1))
strain(:,3) = s3
% Data Visualizations
% We have x, y, and 'z' ...plot3() or surf()?
% 3D Plot!
figure(1)
plot3(strain(:,1), strain(:,2), strain(:,3), ...
'.b', 'Markersize', 20)
title('Strain (MPa) over Sensor Grid')
xlabel('x dist (m)'), ylabel('y dist (m)')
zlabel('strain (MPa)'), grid on
% Scatter Plot w/ Color
figure(2)
scatter(strain(:,1), strain(:,2), ...
strain(:,3)*5, ... % size
strain(:,3), ... % color
'filled')
xlabel('x dist (m)'), ylabel('y dist (m)')
title('Strain (MPa) over Sensor Grid')
cc = colorbar(); title(cc,'MPa')
xlim([0 11]), ylim([0 11]), grid on
------------------------------------------------------------------------------------------------------------------------------------
HELP A BROTHER OUT
Thank you so much for watching! Please consider subscribing as a thank you if you benefited from this content! :D
HELPING MY BROTHERS AND SISTERS OUT
Comment below and I will happily answer all your questions, queries, and conundrums... whether or not they pertain to programming ;)
 0:16:28
2022 How to Load, Clean, and Visualize Raw CSV Data in MATLAB | MATLAB Tutorial
 0:08:15
How To Clean Your Front Load Washing Machine
 0:00:30
Tub Clean Washing Machine Front Load - LG ScalGo # #lgwashingmachine #tubclean #LG
 0:00:15
#lg #washing ashing machine #tub #cleaning
 0:00:14
lg top load washing machine | how to select tub clean
 0:00:17
The Proper Way to Use Baking Soda in a Front Load Washing Machine #procleaningtip #shorts
 0:00:41
Samsung Front Load Washing Machine (2022) - How to Remove/Clean Detergent Drawer
 0:00:20
Top up your dishwasher!
 0:00:29
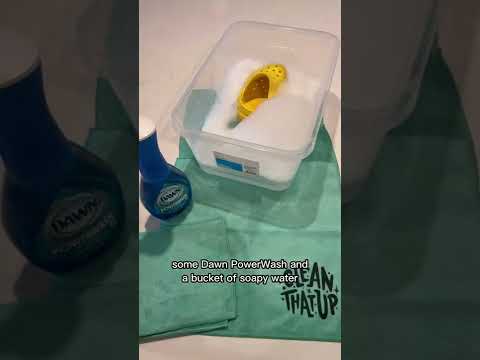
The Best Way To Clean Crocs #cleaning #crocs #cleaningtips #shorts
 0:00:18
HOW TO OPEN WHIRLPOOL pulsator from drum..
 0:00:31
Panasonic Front Load Washers Maintenance - Tub Clean
 0:00:46
LG front loading washing machine tub clean /ScalLGo powder
 0:00:13
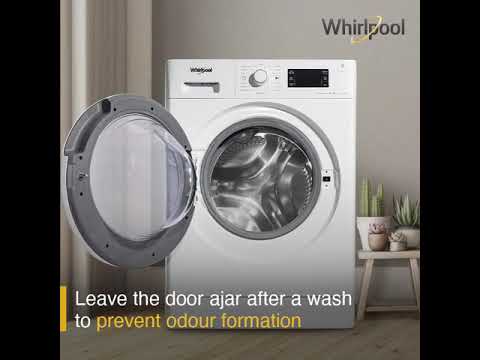
Whirlpool front load washing machine
 0:00:37
Front load washers are proven to wash better. Facts, not opinion
 0:01:00
Here’s how to wash your washer
 0:00:11
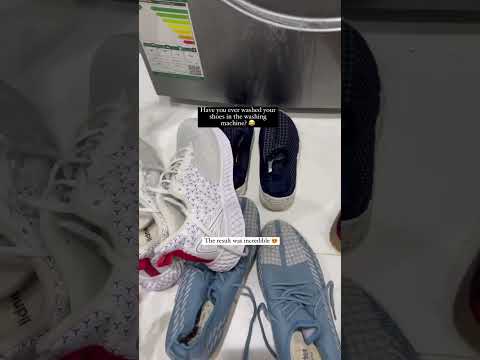
How to wash shoes in the washing machine??? Try this out !!! The result was incredible 😍
 0:01:57
How To Clean Your Washing Machine Filter | Samsung UK
 0:00:13
Clean your Phone Junk Easily 🔥 #shorts #youtubeshorts #files #junk
 0:00:36
I Put A Camera Inside A Dishwasher, This Is What Happened!
 0:00:16
⚠️Scratch Disk Error in Photoshop 2022 | How to FIX it? #shorts #viral
 0:00:16
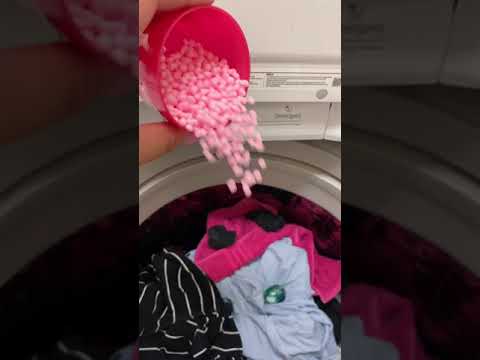
Wash a load of laundry with me 🧺🧼 | What are your favorite laundry products?
 0:00:19
Clean your PS3 before playing again!
 0:00:41
The Shocking Truth About a Top Load Washer that Wont Spin or Drain | Troubleshooting Tip (2023)
 0:00:14
Dry clean at home | astro plus | #shorts
Комментарии