filmov
tv
World Flood Map (Sea Level: Rise & Fall)

Показать описание
This is the map story to show you what happen when the sea level is rising from 0 m to 9000 m and falling from 0 m to -11034 m.
Do you know?
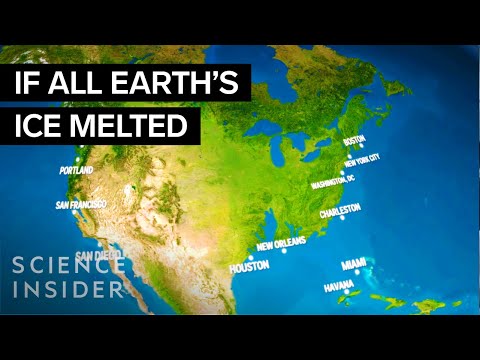
Rising seas is one of those climate change effects. Average sea levels have swelled over 23 cm since 1880.
The most recent special report from the Intergovernmental Panel on Climate Change says we can expect the oceans to rise between 26 and 77 cm by 2100 with temperatures warming 1.5°C. That’s enough to seriously affect many of the cities along the U.S. East Coast.
So let's save our earth together!
******************************************************
I spend a lot of time to do this video, hope you enjoy!
So if you like this, please support us:
SUBSCRIBE, LIKE, COMMENT and SHARE !!!!!
******************************************************
I will publish other videos soon. See you!
Do you know?
Rising seas is one of those climate change effects. Average sea levels have swelled over 23 cm since 1880.
The most recent special report from the Intergovernmental Panel on Climate Change says we can expect the oceans to rise between 26 and 77 cm by 2100 with temperatures warming 1.5°C. That’s enough to seriously affect many of the cities along the U.S. East Coast.
So let's save our earth together!
******************************************************
I spend a lot of time to do this video, hope you enjoy!
So if you like this, please support us:
SUBSCRIBE, LIKE, COMMENT and SHARE !!!!!
******************************************************
I will publish other videos soon. See you!
 0:05:15
World Flood Map | Sea Level Rise (0 - 9000m)
 0:11:03
USA Flood Map | Sea Level Rise (0 - 4000m)
![[4k]Sea Level Rise](https://i.ytimg.com/vi/q87mUl13s-s/hqdefault.jpg) 0:08:08
0:08:08
[4k]Sea Level Rise and Fall Simulation - World
 0:20:12
Lands That Could FLOOD in Our Lifetime
 0:05:17
【Map】Sea Level Rise Simulation - Europe
 0:03:24
World Flood Map - sea level rise (0 to 3000m) - Flood map
 0:02:45
How Earth Would Look If All The Ice Melted | Science Insider
 0:05:15
World Flood Map // Sea Level Rise (0 - 9000m)
 1:41:07
GEOGRAPHY and DISASTER MANAGEMENT I Mains Revision Session 1 I Mains Crash Course #mains2024
 0:08:08
World Flood Map (Sea Level: Rise & Fall)
 0:04:23
Europe flood map! Sea level rise (0 to 1000m)
 0:07:40
Everywhere That Will FLOOD In Our Lifetime
 0:20:48
Geography of Earth with WAY More Water (+2000m)
 0:04:06
World Flood Map | Sea Level Rise (0 - 40m) #sealevelrise #floodmap #elevation
 0:06:48
Future World Map : Climate Change
 0:03:55
Europe sea level rise on map | Europe flood map #mapper #climatechange #globalwarming
 0:05:14
【Map】Sea Level Rise Simulation - USA
 0:04:20
【Map】Sea Level Rise and Fall Simulation - Mexico
 0:04:27
FRANCE Flood Map/Elevation Map | Sea Level Rise (0 - 5000m)
 0:04:02
India Flood Map | Sea Level Rise
 0:06:34
How Will Earth Change If All the Ice Melts?
 0:03:06
USA Flood Map - Rising Sea Levels TIMELAPSE
 0:04:02
Oceania sea level rise (0 - 5000 m ) | Oceania flood map #climatechange #floodmap #mapper
 0:03:16
Florida Sea Level Rise Visualization
Комментарии