filmov
tv
Building Energy Modeling in OpenStudio - Results Summary

Показать описание
In this video, we will discuss how to include (Reporting Measures), access, and navigate some of the varios reports created by OpenStudio and EnergyPlus. We will also briefly discuss some of the information contained in the reports.
Transcript:
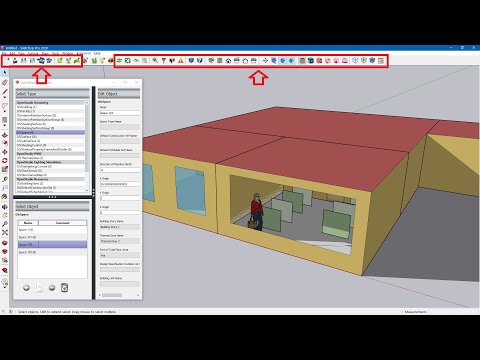
Now, we will briefly discuss reports. First, let's look at the measures tab.
One thing I forgot to mention last time. If you don't already have it installed.
The OpenStudio results measures. There are two different reports that you can output in addition to custom reports.
These are good default reports to use initially.
The EnergyPlus output report is automatically generated, so we don't have to add a measure there.
You already see that we did at output an additional diagnostic report here.
Also, there is an OpenStudio results report. They can be found on the Building Component Library online.
If you go to reporting drop down, QA/QC: Drag and drop OpenStudio results into place.
If you do not already have this, you can find it on the Building Component Library by clicking the find measures on BCL button.
As we discussed in previous examples.
Next, let us go to the results summary tab on the left.
There are two different results reports that have been created for this model.
The OpenStudio results and you can also click the drop down here at the top.
Change it to the EnergyPlus results. Both of these reports are created in an HTML file.
Browse to the Open Studio project folder. Open it. Go to reports.
You will see the EnergyPlus report and the OpenStudio results report.
Let us open the OpenStudio results report. It opens in a standard web browser.
The OpenStudio results report is a summary of a lot of information about the energy model.
It is not as comprehensive as the EnergyPlus report, but it's a little bit easier to read.
Starting at the top, it starts with summary information about the building.
Then it goes to weather summary, sizing period design days.
This has to do with the design day file that we inputted at the very beginning of the model.
These are all the assumptions used for auto sizing the equipment.
Next, there is an unmet hours summary. This is a good summary to look at.
If you have unmet hours in your building it tells you that there might be something wrong with equipment sizing, space loads, or schedules that are overlapping.
Next, the unmet hours tolerance shows the tolerance used for reporting the unmet hours.
If you want to go into further detail with unmet hours, you can go to zone conditions.
Click the zone conditions in the table of contents on the left here.
You can see unmet heating hours on the left and unmet cooling hours on the right.
This table shows you a range of temperatures that the spaces experience throughout the entire year.
If some of the spaces, for example thermal zone 103, fall below the heating setpoint for a certain number of hours, that is considered an unmet hour.
Especially if it's an unmet occupied hour.
Going back to the top, past unmet hours, you have an annual overview with various tables showing end uses.
End uses for various equipment. End uses for utilities. End uses for electricity and gas.
There is also monthly overview tables showing you total usages for electricity and natural gas in monthly time steps.
If you have district equipment, you would also see those tables as well. On a monthly basis.
It is showing district equipment in this example because we we assigned ideal air loads to our thermal zones.
As discussed before, ideal air loads assume an unlimited heating and cooling capacity based on a district heating or cooling system.
Next, we can see peak demands for electricity and natural gas on a monthly basis.
Same for district heating and cooling. We did not input any energy bills. Utility bills.
So, none of that information is shown. Next, it goes into an envelope summary.
Space type breakdowns. This can show you the various space types located throughout your building.
For example. The Apparatus Bay takes up 39% of our building as approximately 2.3 thousand square feet of area.
Hover over each square. You can see the statistics.
Next, going down, it goes into space summary details.
This closed office. It will show you people definitions, electric lights, infiltration, and ventilation.
Go to interior lighting. Same thing. It shows you statistics for interior lighting.
Lighting power densities and total power.
Plug loads is the same. Exterior lighting...
You will recall that we added those exterior lights with an astronomical clock.
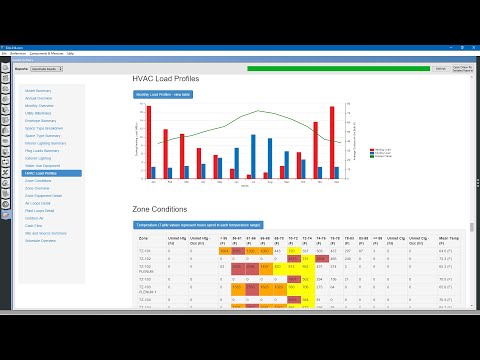
Next, the HVAC load profiles show you heating and cooling loads on a monthly basis with comparison to the outdoor air temperature.
Next, the zone conditions tab. The range of temperatures located within the spaces throughout the year.
In addition to the unmet heating and cooling hours, there's also a humidity table for spaces.
...
Transcript:
Now, we will briefly discuss reports. First, let's look at the measures tab.
One thing I forgot to mention last time. If you don't already have it installed.
The OpenStudio results measures. There are two different reports that you can output in addition to custom reports.
These are good default reports to use initially.
The EnergyPlus output report is automatically generated, so we don't have to add a measure there.
You already see that we did at output an additional diagnostic report here.
Also, there is an OpenStudio results report. They can be found on the Building Component Library online.
If you go to reporting drop down, QA/QC: Drag and drop OpenStudio results into place.
If you do not already have this, you can find it on the Building Component Library by clicking the find measures on BCL button.
As we discussed in previous examples.
Next, let us go to the results summary tab on the left.
There are two different results reports that have been created for this model.
The OpenStudio results and you can also click the drop down here at the top.
Change it to the EnergyPlus results. Both of these reports are created in an HTML file.
Browse to the Open Studio project folder. Open it. Go to reports.
You will see the EnergyPlus report and the OpenStudio results report.
Let us open the OpenStudio results report. It opens in a standard web browser.
The OpenStudio results report is a summary of a lot of information about the energy model.
It is not as comprehensive as the EnergyPlus report, but it's a little bit easier to read.
Starting at the top, it starts with summary information about the building.
Then it goes to weather summary, sizing period design days.
This has to do with the design day file that we inputted at the very beginning of the model.
These are all the assumptions used for auto sizing the equipment.
Next, there is an unmet hours summary. This is a good summary to look at.
If you have unmet hours in your building it tells you that there might be something wrong with equipment sizing, space loads, or schedules that are overlapping.
Next, the unmet hours tolerance shows the tolerance used for reporting the unmet hours.
If you want to go into further detail with unmet hours, you can go to zone conditions.
Click the zone conditions in the table of contents on the left here.
You can see unmet heating hours on the left and unmet cooling hours on the right.
This table shows you a range of temperatures that the spaces experience throughout the entire year.
If some of the spaces, for example thermal zone 103, fall below the heating setpoint for a certain number of hours, that is considered an unmet hour.
Especially if it's an unmet occupied hour.
Going back to the top, past unmet hours, you have an annual overview with various tables showing end uses.
End uses for various equipment. End uses for utilities. End uses for electricity and gas.
There is also monthly overview tables showing you total usages for electricity and natural gas in monthly time steps.
If you have district equipment, you would also see those tables as well. On a monthly basis.
It is showing district equipment in this example because we we assigned ideal air loads to our thermal zones.
As discussed before, ideal air loads assume an unlimited heating and cooling capacity based on a district heating or cooling system.
Next, we can see peak demands for electricity and natural gas on a monthly basis.
Same for district heating and cooling. We did not input any energy bills. Utility bills.
So, none of that information is shown. Next, it goes into an envelope summary.
Space type breakdowns. This can show you the various space types located throughout your building.
For example. The Apparatus Bay takes up 39% of our building as approximately 2.3 thousand square feet of area.
Hover over each square. You can see the statistics.
Next, going down, it goes into space summary details.
This closed office. It will show you people definitions, electric lights, infiltration, and ventilation.
Go to interior lighting. Same thing. It shows you statistics for interior lighting.
Lighting power densities and total power.
Plug loads is the same. Exterior lighting...
You will recall that we added those exterior lights with an astronomical clock.
Next, the HVAC load profiles show you heating and cooling loads on a monthly basis with comparison to the outdoor air temperature.
Next, the zone conditions tab. The range of temperatures located within the spaces throughout the year.
In addition to the unmet heating and cooling hours, there's also a humidity table for spaces.
...
 0:10:44
Energy Modeling 101 OpenStudio Application A-Z
 0:01:18
Building Energy Modeling with OpenStudio
 0:08:37
Building Energy Modeling in OpenStudio - Buildings Loads
 0:06:01
Building Energy Modeling in OpenStudio - Site Tab
 0:15:55
Building Energy Modeling in OpenStudio - Construction Materials
 0:02:20
2 minute Crash Course in Openstudio
 0:07:54
Building Energy Modeling in OpenStudio - Facility Tab
 0:09:51
Building Energy Modeling in OpenStudio - Exhaust MUA
 0:14:50
Building Energy Modeling in OpenStudio - Space Types
 0:35:44
Building Energy Modeling in OpenStudio - SketchUp-1
 0:07:59
Introduction to OpenStudio for EnergyPlus for Building Energy Modelling (Module 2)
 0:31:31
Building Energy Modeling in OpenStudio - Troubleshooting
 0:10:16
OpenStudio Building Energy Analysis Tool | V01 - Installation Guide | EnergyPlus Simulation | NREL
 0:52:14
Building Energy Modeling in OpenStudio - SketchUp-2
 0:12:25
Introduction to OpenStudio for EnergyPlus for Building Energy Modelling
 0:11:47
Building Energy Modeling in OpenStudio - Spaces Tab
 0:11:57
Building Energy Modeling in OpenStudio - Results Summary
 0:10:33
Building Energy Modeling in OpenStudio - Add HVAC-1
 0:14:05
Building Energy Modeling in OpenStudio - Schedules Tab
 0:24:20
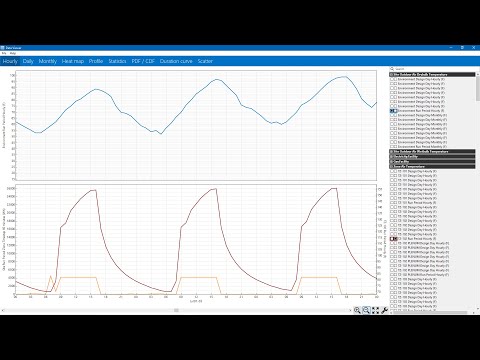
Building Energy Modeling in OpenStudio - Data Viewer
 0:20:42
Building Energy Modeling in OpenStudio - Geometry Tab
 0:17:49
Building Energy Modeling in OpenStudio - Add DOAS System
 0:01:27
OpenStudio Online Training and Tutorials
 0:26:18
Building Energy Modeling in OpenStudio - Troubleshooting 5
Комментарии