filmov
tv
How I Automate Data Visualization in Python

Показать описание
In this video, I will share my data visualization workflow in Python that I use to create professional plots for my clients. We will use the Pandas and Matplotlib library to create a class with functions to automate this process.
Link to project
Timestamps
00:00 Introduction
00:40 Workflow Overview
01:16 Introduction to Case Study
01:55 Objective
02:52 Process Data
04:00 Apply Business Logic
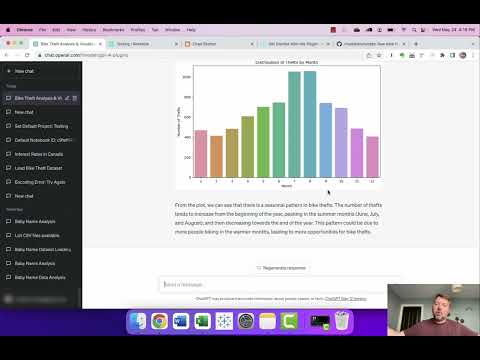
04:54 Create Figures
06:32 Styling Figures
11:22 Exporting Figures
12:30 Converting Code to Functions
15:10 Creating a Plotting Class
Matplotlib documentation
How to Set up VS Code for Data Science
The Best Way to Organize Your Data Science Projects
Let's Connect
Link to project
Timestamps
00:00 Introduction
00:40 Workflow Overview
01:16 Introduction to Case Study
01:55 Objective
02:52 Process Data
04:00 Apply Business Logic
04:54 Create Figures
06:32 Styling Figures
11:22 Exporting Figures
12:30 Converting Code to Functions
15:10 Creating a Plotting Class
Matplotlib documentation
How to Set up VS Code for Data Science
The Best Way to Organize Your Data Science Projects
Let's Connect
 0:18:12
How I Automate Data Visualization in Python
 0:15:39
Automatically Visualize Datasets with AutoViz in Python
 0:06:10
Autoviz-Automatically Visualize Any Dataset With Single Line Of Code
 0:11:02
Data Visualization in 2024 | The Ultimate Guide
 0:01:48
How to automate insights with Tableau Data Stories
 0:14:31
Power BI & Power Automate - How to automate reporting process
 0:39:30
Query Your CSV using LIDA: Automatic Generation of Visualizations with LLMs
 0:13:24
Auto Data Visualization using AutoViz
 0:57:23
Bridging Science and Business: Interactive Analytics Through Data Visualization
 0:00:34
Top useful website for data visualization
 0:13:56
How I use Python as a Data Analyst
 0:20:12
How to do data analysis using AI with ChatGPT and the Noteable plugin
 0:08:13
Excel AI - data analysis made easy
 0:06:42
AI Visualization - Generate Automatic Insights & Narrative using SMART NARRATIVE visual | POWER ...
 1:14:30
Is This Microsoft Excel?! Financial Statistics Dashboards System | Tutorial 1
 0:08:16
How to use Analyze Data in Excel (AI Creates Pivot Tables and Charts)
 0:06:27
Pull data from API using Python
 0:15:10
How to create Power BI Dashboard (Report) in 7 Minutes in Power BI Desktop | @PavanLalwani
 0:16:31
Turn An Excel Sheet Into An Interactive Dashboard Using Python (Streamlit)
 0:12:32
Power BI Tutorial for Beginners
 0:30:37
How to build Dynamic & Interactive Dashboard in EXCEL with Pivot Tables&Charts | Tutorial Ep...
 0:15:53
Visualizing Excel Files Easily With Python
 0:15:18
7 Best Data Visualization Tools in 2024 [Full Software Demo]
 0:09:22
Build with Me: Visualize Data using Amazon QuickSight | AWS Project
Комментарии