filmov
tv
Linux Performance Tools, Brendan Gregg, part 1 of 2

Показать описание
Tutorial by Brendan Gregg of Netflix for O'Reilly Velocity conference 2015 Santa Clara. Part 1 of 2.
Description: "
There are many performance tools nowadays for Linux, but how do they all fit together, and when do we use them? This tutorial explains methodologies for using these tools, and provides a tour of four tool types: observability, benchmarking, tuning, and static tuning. Many tools will be discussed, including top, iostat, tcpdump, sar, perf_events, ftrace, SystemTap, sysdig, and others, as well observability frameworks in the Linux kernel: PMCs, tracepoints, kprobes, and uprobes.
This tutorial is updated and extended on an earlier talk that summarizes the Linux performance tool landscape. The value of this tutorial is not just learning that these tools exist and what they do, but hearing when and how they are used by a performance engineer to solve real world problems — important context that is typically not included in the standard documentation."
 0:54:29
Linux Performance Tools, Brendan Gregg, part 1 of 2
 0:01:13
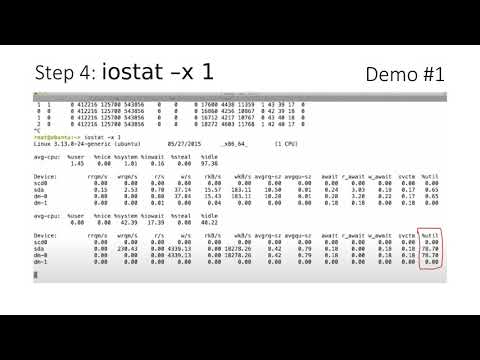
Linux Performance Analysis in 60 seconds
 0:45:27
Linux Performance Tools, Brendan Gregg, part 2 of 2
 0:10:51
Linux Performance Troubleshooting Demos
 0:18:21
Give me 15 minutes and I'll change your view of Linux tracing
 0:49:47
Linux Performance Tools, Brendan Gregg, LinuxCon Europe 2014
 0:21:02
#Linux Performance 2018 - Brendan Gregg - #Percona Live 2018
 1:05:48
SCALE14x Broken Linux Performance Tools (2016)
 0:43:51
Velocity 2017: Performance Analysis Superpowers with Linux eBPF
 0:42:44
Kernel Recipes 2017 - Performance Analysis with BPF - Brendan Gregg
 1:05:45
Broken Linux Performance Tools
 0:59:42
Cloud Performance Root Cause Analysis at Netflix • Brendan Gregg • YOW! 2018
 0:05:40
Linux Performance Tools
 1:01:19
Linux Systems Performance
 1:00:59
Keynote 3: System Performance Analysis Methodologies - Brendan Gregg
 0:51:06
Kernel Recipes 2017 - Perf in Netflix - Brendan Gregg
 0:19:06
Performance Wins with BPF: Getting Started - Brendan Gregg, Netflix - Full Keynote
 0:17:10
Getting Started with BPF observability – Brendan Gregg, Netflix
 1:02:00
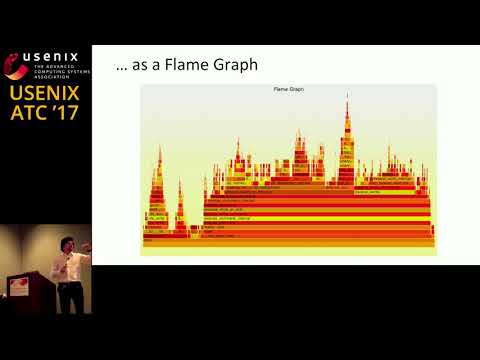
USENIX ATC '17: Visualizing Performance with Flame Graphs
 1:00:59
Keynote 3: System Performance Analysis Methodologies, by Brendan Gregg (EuroBSDcon 2017)
 0:42:49
LISA17 - Linux Container Performance Analysis
 0:46:26
Stop the Guessing: Performance Methodologies for Production Systems
 0:53:31
Brendan Gregg - Performance Analysis
 1:07:20
eBPF: Fueling New Flame Graphs & more • Brendan Gregg • YOW! 2022
Комментарии