filmov
tv
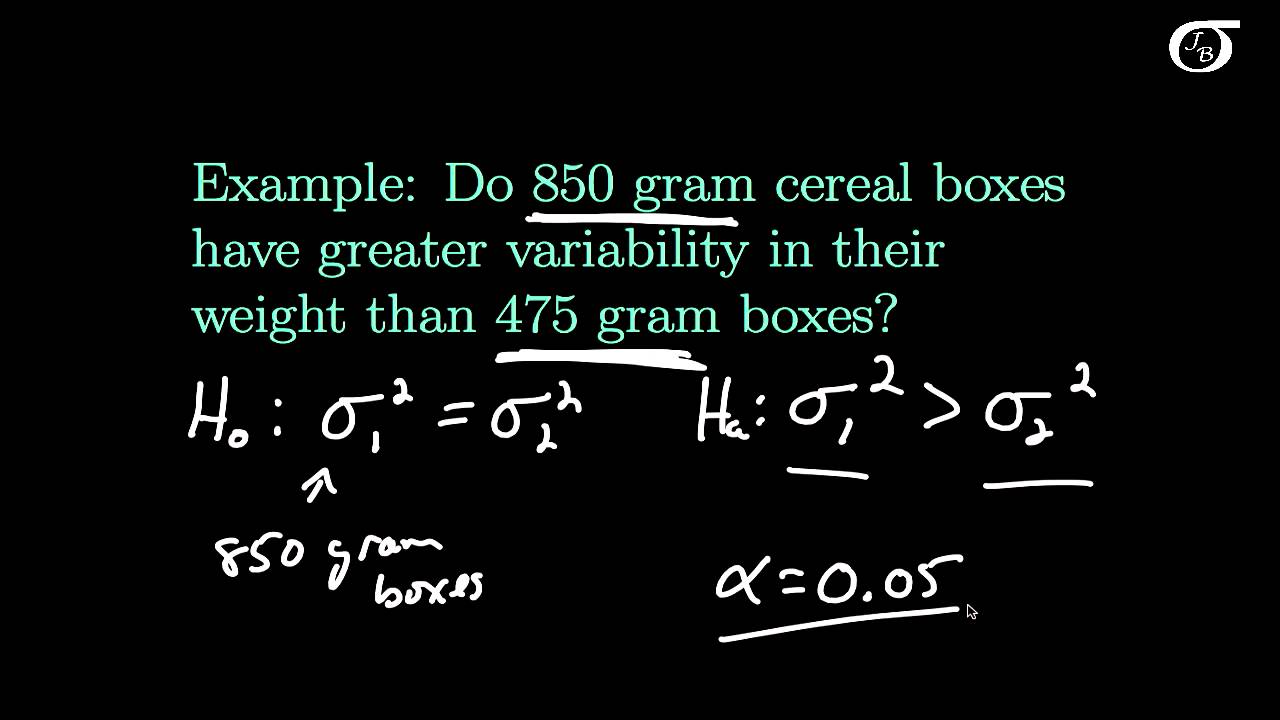
Hypothesis Tests for Equality of Two Variances
Показать описание
I discuss the F test for equality of two population variances, based on the assumption of normally distributed populations, then work through an example. Note that these methods do not work well when the populations are not normally distributed.
 0:11:40
Hypothesis Tests for Equality of Two Variances
 0:03:00
Hypothesis test for Equality of Two Variances | F-test
 0:13:34
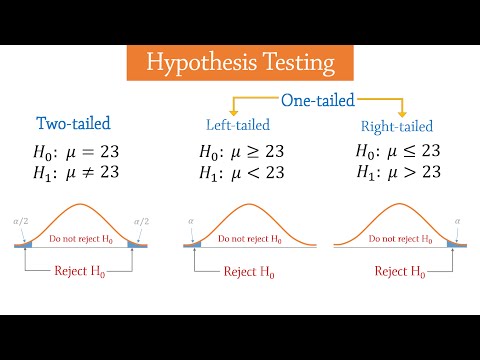
Hypothesis Testing Problems - Z Test & T Statistics - One & Two Tailed Tests 2
 0:04:00
Hypothesis Testing - Introduction
 0:06:00
Test Statistic For Means and Population Proportions
 0:06:52
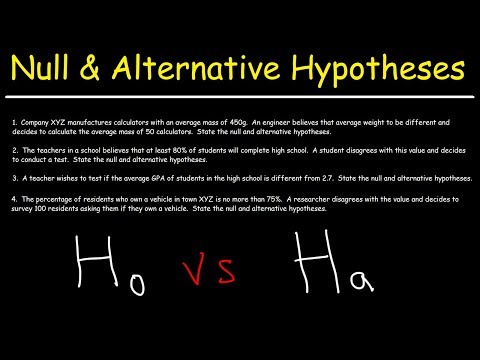
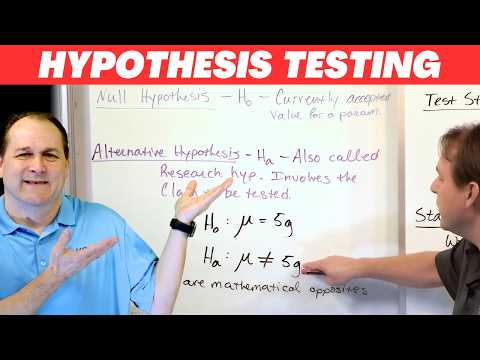
Hypothesis Testing - Null and Alternative Hypotheses
 0:18:36
Hypothesis Testing - Difference of Two Means - Student's -Distribution & Normal Distributio...
 0:14:52
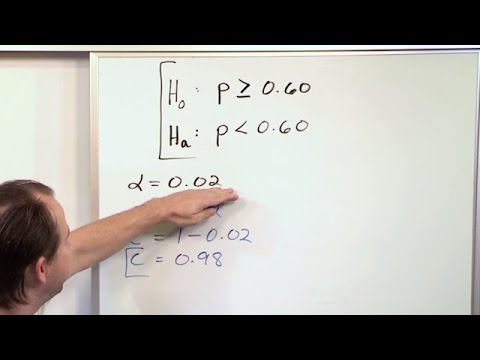
Null and Alternate Hypothesis - Statistical Hypothesis Testing - Statistics Course
 0:16:39
Hypothesis Testing in Statistics - Means w/ Small Samples
 0:23:41
Intro to Hypothesis Testing in Statistics - Hypothesis Testing Statistics Problems & Examples
 0:04:08
Levene's test [Test for variance equality]
 0:19:01
CFA Level 1 Reading 6: Hypothesis Testing - Complete CRASH COURSE 2023 - Wall Street Notes
 0:08:52
Hypothesis Tests for One Population Variance
 0:16:14
t-Test - Full Course - Everything you need to know
 0:10:15
Hypothesis testing
 0:08:41
The F Test, Comparing Two Variances, Problem 1
 0:12:00
Simple Linear Regression, hypothesis tests
 0:12:46
Hypothesis Testing - Two Sample t test with equal variances
 0:15:41
T -Test Statistic for Two Independent Populations Assuming Equal Variances
 0:06:34
Hypothesis testing in excel
 0:05:46
Hypothesis Test for Simple Linear Regession
 0:17:48
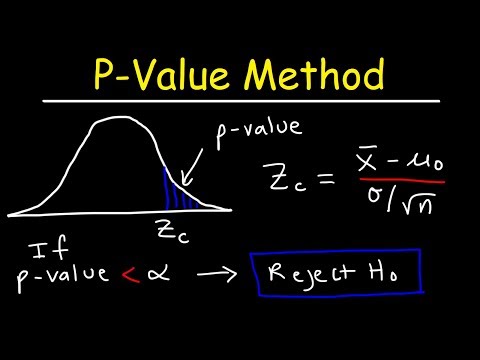
P-Value Method For Hypothesis Testing
 0:15:49
Hypothesis Testing - Solving Problems With Proportions
 0:08:15
F-Test for two sample variances
Комментарии