filmov
tv
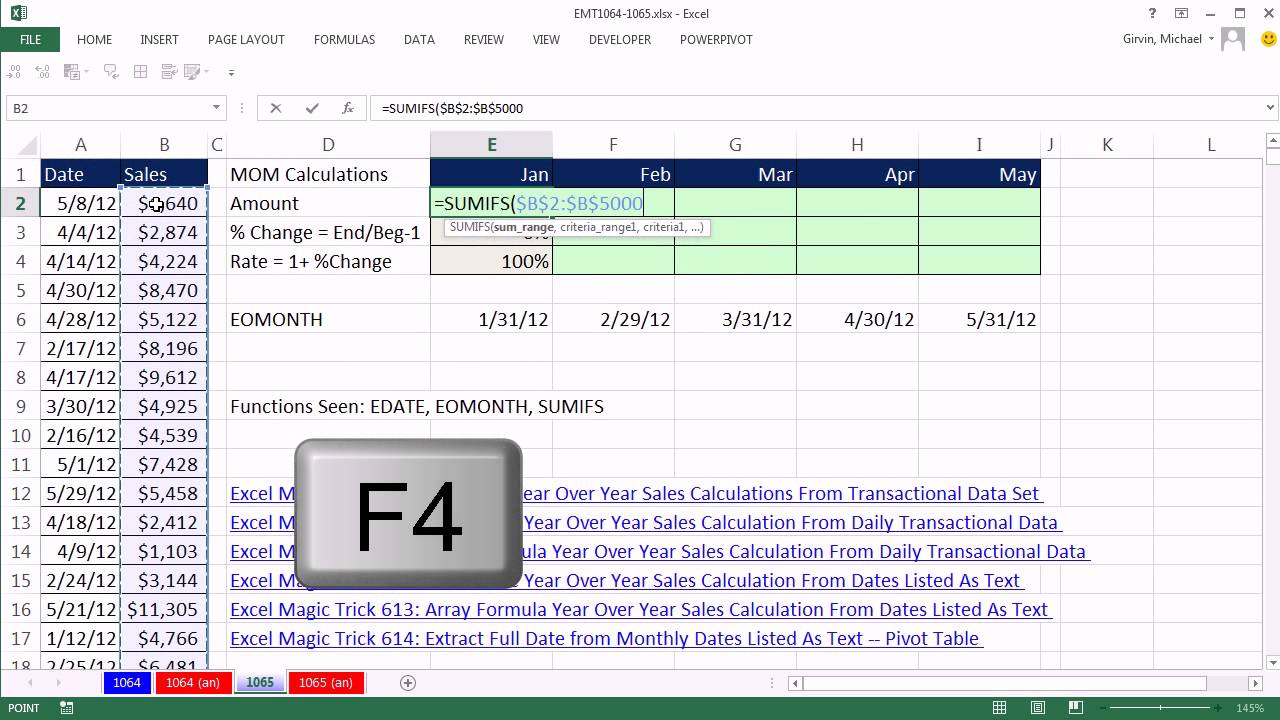
Excel Magic Trick 1065: SUMIFS: Month Over Month Sales Calculations From Transactional Data Set
Показать описание
See How to calculate Month Over Month Sales Calculations From Transactional Data Set using:
1. (00:40 min) Mouse Drag and Smart Tag to calculate the first of each month
2. (01:06 min) EDATE function to calculate the first of each month
3. (01:55 min) Custom Number Format to show serial Number Dates as Month Abbreviated Names
4. (02:49 min) EOMONTH to calculate the end of the month
5. (03:40 min) SUMIFS to calculate Month Sales
6. (06:00 min) Formula For Percentage Change
7. (06:28 min) Formula For Rate
 0:06:51
Excel Magic Trick 1065: SUMIFS: Month Over Month Sales Calculations From Transactional Data Set
 0:06:51
Excel Magic Trick 1065 SUMIFS Month Over Month Sales Calculations From Transactional Data Set
 0:10:35
Excel Magic Trick 1455: Convert Text Month Criteria to Upper & Lower Dates for SUMIFS Function
 0:08:42
Excel Magic Trick 1476: SUMIFS to Add Expenses for Any Time Period (Adding with Three Conditions)
 0:07:23
Excel Magic Trick 1062: SUMIFS: Year Over Year Sales Calculations From Transactional Data Set
 0:07:26
Excel Magic Trick 1089: Month, Year To Date and Variances with SUMIFS, PodCast 1873 Mr Excel
 0:04:24
Excel Magic Trick 1251: SUMIFS & Table Formula Nomenclature (Structured References) to Add Invoi...
 0:07:54
Excel Magic Trick 1368: How To get SUMIFS to Calculate Sum Of Amazon And Google Under Each Region
 0:01:30
Excel Magic Trick 1064: Copy Formulas Even More Quickly With F5 Key and Shift + Enter
 0:03:46
Excel Magic Trick 1083: SUMIFS: Add Invoice Amounts Between Start & End Dates (Adding For Period...
 0:04:05
6b Sales Rep sales dollars using SUMIFS in Excel
 0:07:23
Excel Magic Trick 1062 SUMIFS Year Over Year Sales Calculations From Transactional Data Set
 0:04:39
Excel Magic Trick 1537: SUMIFS & DAY Functions to calculate Average Daily Revenue
 0:01:32
Excel Magic Trick 1061: Copy Formulas Quickly With Name Box and Shift Key (Horizontal or Vertical)
 0:35:37
Find Monthly Sales sum using SumIF Formula in Microsoft Excel
 0:09:32
sumif counif year
 0:02:41
Excel Tricks - How to Sum Values Between Two Dates Using SUMIFS || Find Sum Between Two Dates
 0:00:57
sumifs function in excel
 0:02:18
Excel SUMIFS function
 0:05:40
Excel - SUMIFS for multiple conditions - Episode 2043
 0:04:50
|| SUM MONTHWISE || EOMONTH+SUMIF+SUMIFS || PRACTICAL APPLICATION ||
 0:03:53
How to sum data based on week using SUMIF Microsoft Excel
 0:03:56
Excel Magic Trick 1067: Displaying Fractional Percent in Excel like: 33 1/3 % or 3/10%
 0:02:23
Excel Magic Trick 1066: PivotTable: Month Over Month Sales Calculations From Transactional Data Set
Комментарии