filmov
tv
How to Compare Two Date Ranges from the Same Data Set in One View in Tableau Desktop
Показать описание
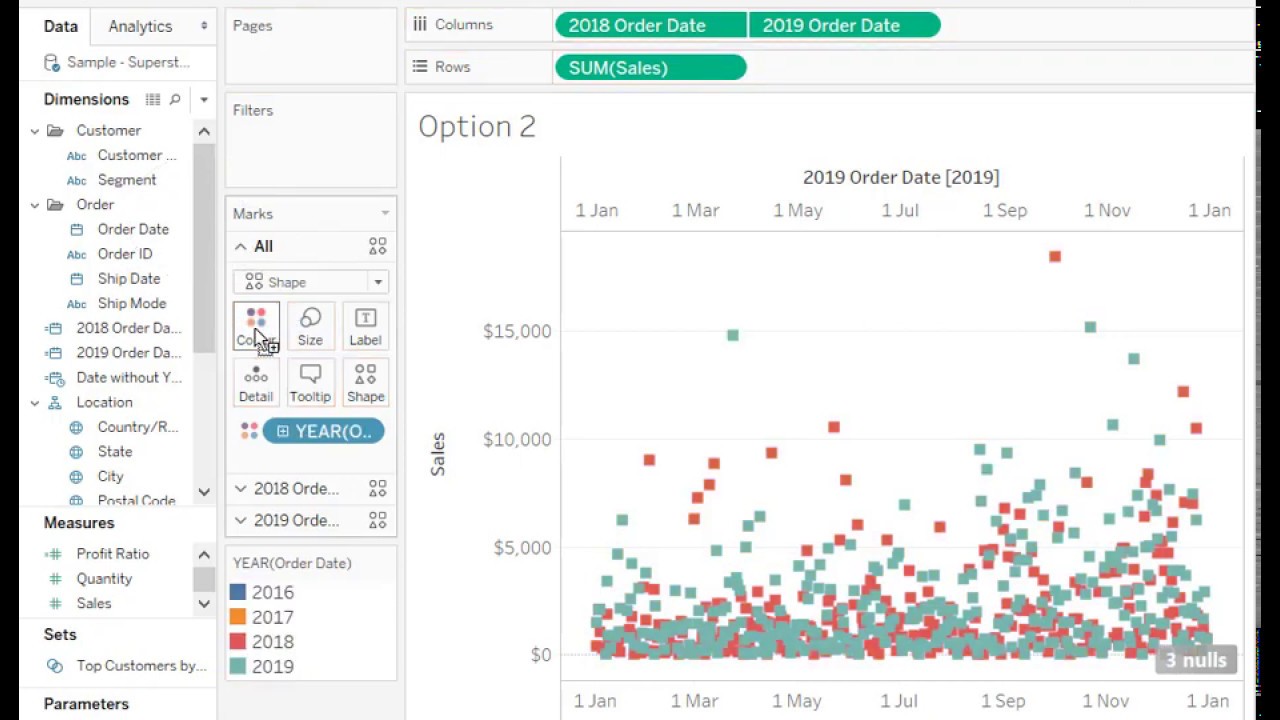
In this silent video, you’ll learn how to compare two date ranges from the same data set on one graph in Tableau Desktop.
- - - - - - - - - - - - - -
1. Create a calculated field for the first date range. The example below uses the year 2018:
date(IF year([Order Date])=2018
THEN [Order Date]
END)
2. Create a calculated field for the second date range. The example below uses the year 2019:
date(IF year([Order Date])=2019
THEN [Order Date]
END)
3. Place both calculated fields on the Columns shelf, selecting Continuous, Exact Date.
4. Right-click the second date range and select Dual Axis.
5. Drag Sales to Rows.
6. Drag Order Date to Color on the Marks card for All.
- - - - - - - - - - - - - -
- - - - - - - - - - - - - -
1. Create a calculated field for the first date range. The example below uses the year 2018:
date(IF year([Order Date])=2018
THEN [Order Date]
END)
2. Create a calculated field for the second date range. The example below uses the year 2019:
date(IF year([Order Date])=2019
THEN [Order Date]
END)
3. Place both calculated fields on the Columns shelf, selecting Continuous, Exact Date.
4. Right-click the second date range and select Dual Axis.
5. Drag Sales to Rows.
6. Drag Order Date to Color on the Marks card for All.
- - - - - - - - - - - - - -
 0:03:31
 0:06:05
 0:05:10
 0:08:17
 0:00:38
 0:03:48
 0:01:14
 0:02:39
 0:04:32
 0:03:12
 0:07:40
 0:08:05
 0:01:06
 0:01:52
 0:06:11
 0:03:31
 0:00:34
 0:01:23
 0:04:08
 0:01:20
 0:04:08
 0:02:21
 0:06:15
 0:00:37