filmov
tv
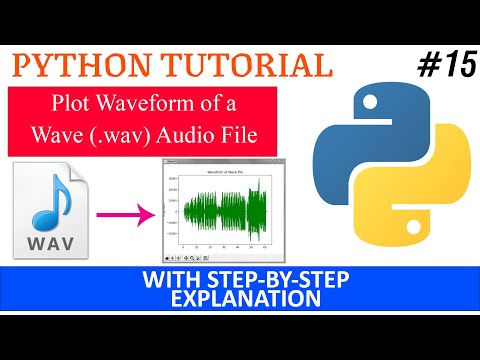
Python Program - Plot A Wave Audio File | Matplotlib & NumPy Tutorial

Показать описание
Hey Everyone, In this tutorial, I show you, how to plot a wave (.wav) Audio File in Python.
→Make Sure your Audio is Mono, ie. It has only one Channel
→Please Be Sure to Like this Video, and Subscribe to my Channel.
===================================================
◘ My other Programming Tutorials →
===================================================
• Some of my How-to Tutorials →
→Make Sure your Audio is Mono, ie. It has only one Channel
→Please Be Sure to Like this Video, and Subscribe to my Channel.
===================================================
◘ My other Programming Tutorials →
===================================================
• Some of my How-to Tutorials →
 0:13:47
How to: Plot a Function in Python
 0:09:40
Python Program - Plot A Wave Audio File | Matplotlib & NumPy Tutorial
 0:05:49
Intro to Plotting with Python
 0:19:13
Python Tutorial for Beginners #13 - Plotting Graphs in Python (matplotlib)
 0:04:18
How To Plot an Algebra Equation By Python
 0:07:09
how to plot an exponential function in python | plotting exponential function in pycharm
 0:07:21
Python 3 Programming Tutorial - Matplotlib plotting from a CSV
 0:06:36
how to plot a sin wave in python | how to plot a sin wave in pycharm | sin function plot in python
 0:00:58
7️⃣ Pandas in Data-Driven Engineering #pythonpandas #engineering #datascience
 0:06:43
Learn Matplotlib in 6 minutes | Matplotlib Python Tutorial
 0:13:11
How to Plot a Histogram in Python using Matplotlib
 0:05:57
How To Plot Points In Python
 0:20:34
Matplotlib Tutorial (Part 9): Plotting Live Data in Real-Time
 0:24:11
How to: Import, Plot, Fit, and Integrate Data in Python
 0:05:40
#13 Polar plot in Python | Non-linear plotting | Matplotlib tutorial 2021
 0:21:59
Tutorial 26 - Basic plotting in python using matplot.pyplot
 0:05:17
python matplotlib graphs using csv files, bar, pie, line graph
 0:05:54
Python Scatter Plots and Bubble Charts with Matplotlib and Seaborn
 0:22:01
Intro to Data Analysis / Visualization with Python, Matplotlib and Pandas | Matplotlib Tutorial
 0:06:00
3D Line Chart Plotting in Python using Matplotlib
 0:22:47
PYTHON TUTORIAL :How to Read Excel File and Do Basic Plotting
 0:06:48
Sine and Cosine Graph | Matplotlib | Python Tutorials
 0:35:01
Matplotlib Tutorial (Part 1): Creating and Customizing Our First Plots
 0:00:57
Learn to create a XY plot quickly in Python.
Комментарии