filmov
tv
Sine and Cosine Graph | Matplotlib | Python Tutorials

Показать описание
In this Python Programming video tutorial you will learn about how to draw sine and cosine graph using matplotlib in detail.
Matplotlib is a plotting library for the Python programming language and its numerical mathematics extension NumPy.
Linspace()
matplotlib:
#matplotlib #Python
For more free tutorials on computer programming
Matplotlib is a plotting library for the Python programming language and its numerical mathematics extension NumPy.
Linspace()
matplotlib:
#matplotlib #Python
For more free tutorials on computer programming
 0:14:07
Graphing Sine and Cosine Functions with Transformations (Multiple Examples)
 0:22:37
How To Graph Trigonometric Functions | Trigonometry
 0:11:40
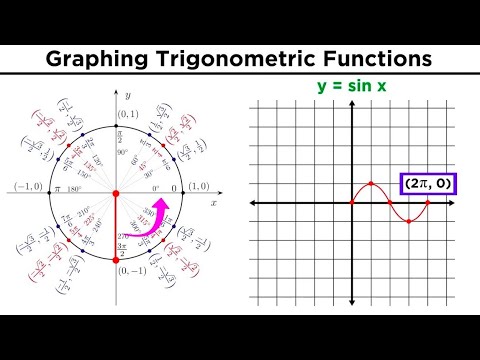
Graphing Trigonometric Functions
 0:06:20
Sine or Cosine Writing Equations Given Graph
 0:01:12
Visualizing Trigonometry: Sine Function
 0:00:27
Sine Curve and the Unit Circle
 0:12:00
Graphing Sin and Cos
 0:07:24
Determining the Equation of a Sine and Cosine Graph
 0:00:12
#graphs #cosine #physics #maths #science #physicswallah #trigonometry #shorts #viralshorts
 0:20:37
Trigonometric Graphs - GCSE Higher Maths
 0:34:34
The Graphs of Sine and Cosine (Precalculus - Trigonometry 11)
 0:00:16
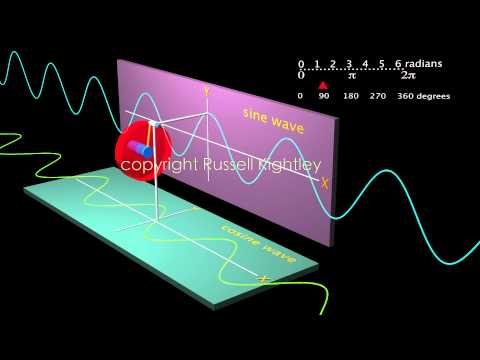
sine cosine wave animation by Russell Kightley
 0:00:16
Sine and cosine visualized!
 0:43:05
Graphing the Sine & Cosine Functions - [2-21-8]
 0:00:54
Sine & cosine function. How to draw sine & cosine graph.
 0:17:03
Graphing Sine and Cosine Using a Table and Transformations
 0:30:12
Sine, Cosine and Tangent graphs explained + how to sketch | Math Hacks
 0:10:38
Graphing Trigonometric Functions (Example: y = 3cos(x) - 2)
 0:06:52
Trigonometric Graphs
 0:04:34
What are the critical points of a sine and cosine graph
 0:31:57
Trigonometric Graphs & 5 Hard Exam Style Questions | Grade 7-9 Series | GCSE Maths Tutor
 0:00:50
Can Cosine Functions Intersect EXACTLY Once? 🤔
 0:03:34
Example 3: Graphing a Transformation of Sine and Cosine
 0:08:10
(New Version Available) Graphing the Sine and Cosine Function
Комментарии