Excel What-If Analysis Data Table | Easy to Use Once you Learn This☝️

preview_player
Показать описание

Unravel the power of Excel's What-If Analysis Data Table in our latest tutorial. Ideal for professionals and students alike, this video simplifies complex financial forecasting and scenario analysis, guiding you through practical examples. Learn how to make informed decisions by simulating various financial scenarios in Excel.

In This Tutorial:
▪️ Introduction to What-If Analysis: Grasp the basics of Excel's powerful forecasting tool.
▪️ One-Variable Data Table: Learn to analyze changes in one financial parameter.
▪️ Two-Variable Data Table: Explore how to simultaneously vary two parameters for in-depth analysis.
▪️ Practical Financial Scenarios: Apply these techniques to real-world financial forecasting scenarios.

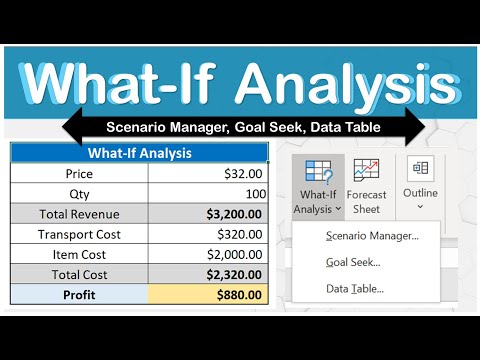
Use an Excel Data Table What-if Analysis to quickly create multiple results based on a formula you already have. The data table in Excel will allow you to change values in some cells and come up with different answers to the problem. This is what Microsoft Excel's What-if Analysis Data Table does best - it allows you to experiment with different input variables. A Data Table allows you to see how different input values would impact the result at one glance. It's quite a hidden Excel tip and trick. Data Tables can be confusing at first, but this tutorial explains it in simple English and in a way, you will never forget how to use this feature again.

00:00 What-If Analysis in Excel - Most Simple Explanation
00:16 Data Table - 1 Variable
04:47 Bonus Trick: Custom Formatting as icon
05:55 Data Table - 2 Variables
08:07 Wrap Up

🎬 LINKS to related videos:

🚩Let’s connect on social:

This description contains affiliate links, which means at no additional cost to you, we will receive a small commission if you make a purchase using the links. This helps support the channel and allows us to continue to make videos like this. Thank you for your support!

#excel
Рекомендации по теме
Комментарии
Автор

Leila, there is a really neat way to use data tables, eg to run a set of scenarios with many variable parameters. To do this, 1. set up the scenarios, one per row, with the parameters in as many columns as you want alongside. 2. Create a scenario selection cell that will look up all the parameters for a given scenario, using the scenarios number as a row offset, ie 1 will pick the items in the first scenario row. In this way, you can select a whole scenario's worth of inputs by changing one cell. 3. Create a data table with the inputs down the left being the sequence 1, 2, 3, 4.... for the number of scenarios. In the columns alongside, put the values you want to store for each scenario. Now run the data table and it will process all the scenarios and produce a set of results for each. So in this way, you can change many variables using a data table, which is extremely useful.

dermotbalson
Автор

Great video!!
Alternatives: FV is also dynamic:
=FV(SEQUENCE(17, , 0.03, 0.005)/12, 20*12, -200)
=FV(SEQUENCE(17, , 0.03, 0.005)/12, SEQUENCE(, 7, 4, 4)*12, -200)
Or an universal approach, an user friendly custom-made lambda helper function, for any function fn(x, y)
WIDT(r, c, fn, [nm]) What If Data Table Lamda Helper Function. Arguments; r: rows vector(vert), c: clms vector(horiz), fn: lambda helper function, [nm]: results name (top left cell)
=LAMBDA(r, c, fn, [nm],
LET(
w, IF(ISOMITTED(r), 1, ROWS(r)),
l, IF(ISOMITTED(c), 1, COLUMNS(c)),
m, MAKEARRAY(w, l, LAMBDA(x, y, fn(INDEX(r, x), INDEX(c, y)))),
HSTACK(VSTACK(IF(ISOMITTED(nm), "Wht if", nm), r), VSTACK(c, m))
)
)
We can call:
=WIDT(SEQUENCE(17, , 0.03, 0.005), 20, LAMBDA(x, y, FV(x/12, y*12, -200))) for first first scenario
=WIDT(SEQUENCE(17, , 0.03, 0.005), SEQUENCE(, 7, 4, 4), LAMBDA(x, y, FV(x/12, y*12, -200))) for 2nd scenario
The function lists the results with rows/clm headers. ✌

Excelambda
Автор

Leila, you are the best tutor I have ever listened too. All your presentations makes things look simple and flawless and they are very easy to understand. You are truly my MVP when it comes to Excel and Power BI

mik
Автор

Leila, you are the best teacher ever! I just currently found your channel, and already using some new features you showed me. THANK YOU! You are brilliant!

gedoeniko
Автор

This could have use cases for sure, but it certainly is not very intuitive. Thanks for sharing Leila.

mattschoular
Автор

I don't have a background in finances, but I manage my own budget in Excel. The other day I was wondering how I could make these kinds of projections. This is a great video! Easy to understand and informative. Thank you!

leonardoggy
Автор

Thank you Leila! I had used Data Tables long back and your video was a much needed refresher to revise and start using them again where needed. Great! 🙂

vijayarjunwadkar
Автор

Hi Leila, this is a great tutorial! I was hoping you could offer some guidance on a couple of questions. Q1: is there a way to dynamically change the size of the datatable? I'm thinking with Array Formulas or if the output can be dynamically changed to an Excel table. Q2: Is there a way to "consume" the data table that gets created? For example with PowerQuery, Python in Excel. Thanks!

manrique
Автор

Thank you, Leila, for this wonderful tutorial!
I am a professional UX/UI designer trying to switch careers and become a full-time data analyst or at least part-time.
I've been working with SQL for a long time since I am a CS graduate and I recently learned SSIS, and Power BI on my own.
I was actually having a little bit of a rough time with the concepts of data analysis and formulas, etc. so I decided to learn Excel. I stumbled upon Data Tables last week, I got stuck on it and I just couldn't understand why are data tables used and how to use them. It's been two weeks now, I tried searching around and watched numerous videos on Youtube but no one explained it better than you did.

streakphreak
Автор

So nice to return to my standard early morning routine, 'Thursday's With Leila', i.e. hot coffee, biscotti and another insightful training video ... and I know exactly where I will employ this technique. Thank you ... thank you .... thank you.

nice to have you back ... 😍😍😍😍

chh
Автор

Thank you for adding some much-needed explanation and clarity to this element of Excel. A video is worth 1, 000, 000 (1, 000²) words. The example helps demonstrate what's going on.

Too bad the real world doesn't work quite so easily. "Yes, I need my interest rate to be twice as much to achieve my goals." and BOOM! The interest rate is double. The most controllable piece of the equation is the monthly contribution. But that's a completely different conversation. 😀 Hmm, now that might be a slightly better example with a double lesson: the data table and the contribution amount.

jackcurl
Автор

watched so many data table videos, it kind of always seemed unintuitive. With this video, I kind of got a sense that I got it. Thanks!

Seftehandle
Автор

Thank you very much. I used Access with mathematical formulas to create reports of hardware needs forecasting. Based on your explanation, I tried to do the same with "What If" in Excel and created a vast and complex forecast of hardware needs based on many parameters. All are presented on one sheet without the need for complex report creation. Thank you!

ronspi
Автор

You are great to explain things in a simple way. Thank you, Leila.

ErkanGungorStudent
Автор

Wow ! Couldn’t have asked for a better explanation. Kudos !

nishamali
Автор

Every time when i have any query I have also found the most suitable solution from your channel. Good Job,

naeemjan
Автор

I have been following your your videos for many years now.
I am convinced that we all use not more than 10% of what Excel offers. Great video as always.

sachinrv
Автор

I almost cried reading the textbook. Thanks you 😊❤

hithat
Автор

Ms Leila, you're my favorite Excel Teacher.
Love you, from Malaysia

ryanng
Автор

Love it, Leila! Another great, simple, and more importantly, useful, tutorial!

andyhydes