filmov
tv
Computing Central Tendency (Mean, Median, Mode) in JASP (5-9)

Показать описание
We walk through the steps to identify three measures of central tendency (mean, median, and mode) using JASP. This is an excellent introduction to JASP software and some of the functions that we will use throughout the introductory statistics course.
This video teaches the following commands and techniques in JASP:
Open SPSS data in JASP
Descriptive Statistics
Descriptive Plots
Assessing a distribution for normality
This video uses the dataset StatsClass.SAV and JASP version 11.1
Link to a Google Drive folder with all of the files that I use in the videos including spreadsheets, the Bear Handout, and datasets. As I add new files, they will appear here, as well.
To download, hover your cursor over the file icon and a blue download icon will appear. You do not need to request access to a file.
 0:11:04
Math Antics - Mean, Median and Mode
 0:11:38
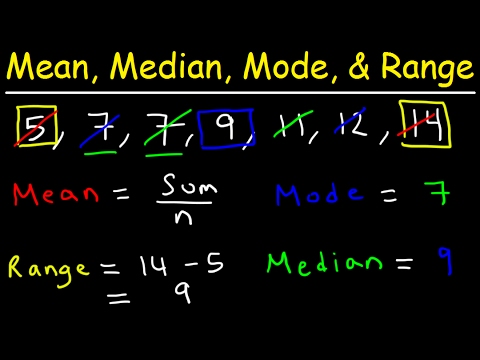
Mean, Median, Mode, and Range - How To Find It!
 0:14:34
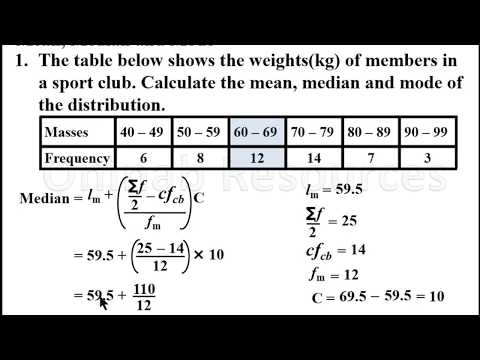
Mean, Median, and Mode of Grouped Data & Frequency Distribution Tables Statistics
 0:04:03
Measure Central Tendency : Mean-Median-Mode and Range
 0:03:55
Finding mean, median, and mode | Descriptive statistics | Probability and Statistics | Khan Academy
 0:09:06
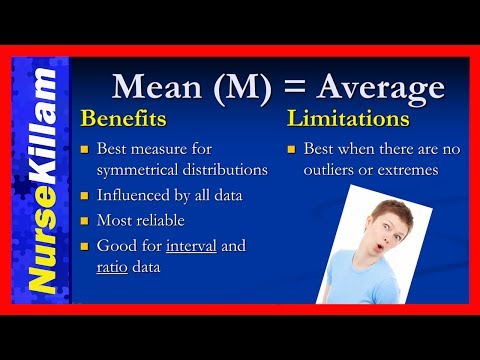
Measures of Central Tendency (Mean, Median, Mode)
 0:11:23
Mean, Median, and Mode: Measures of Central Tendency: Crash Course Statistics #3
 0:05:41
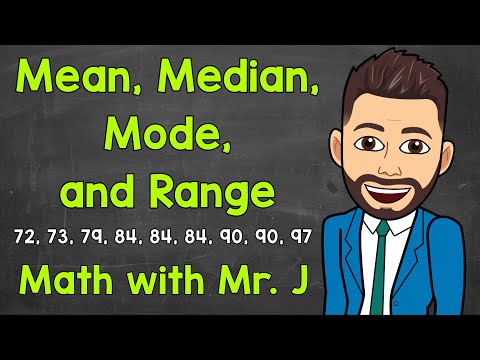
Mean, Median, Mode, and Range | Math with Mr. J
 0:07:37
Day 12: Introduction to EDA | Descriptive Statistics| Central Tendency| Dispersion
 0:13:28
Examples of Finding the Measures of Central Tendency - Mean, Median and Mode
 0:09:51
Computing Central Tendency (Mean, Median, Mode) in JASP (5-9)
 0:12:36
Mean, median and mode of grouped Data(Lesson 1)
 0:03:15
Central Tendency | Mean Median Mode Range | MathHelp.com
 0:04:25
What is Central Tendency – An Introduction to Mean, Median, and Mode in Statistics (5-1)
 0:03:25
Mean, Median and Mode - Measures of Central Tendency
 0:07:50
Statistics - Mean, Median & Mode for a grouped frequency data
 0:05:36
How To Calculate The Median Using a Formula - Statistics
 0:06:19
Mean Median and Mode: Understanding and Calculating Measures of Central Tendency
 0:07:08
Measure of Central Tendency - What? Why? How? || Mean || Median || Mode || Statistics for Beginners
 0:12:12
How to find the mean, median, mode, standard deviation and variance.
 0:02:23
Mean, Median, and Mode
 0:06:37
Calculating Mean, Median, Mode from Frequency Distribution
 0:00:45
SPSS - Mean, Median, Mode, Standard Deviation & Range
 0:00:23
Mean median mode range
Комментарии