filmov
tv
Statistics | Measure of Central Tendency

Показать описание
Measures of Central Tendency
Introduction
A measure of central tendency is the use of a single value to describe a set of data by identifying the central position within that set of data. As such, measures of central tendency are sometimes called measures of central location. They are also classed as summary statistics. The mean (often called the average) is most likely the measure of central tendency that you are most familiar with, but there are others, such as the median and the mode.
The mean, median and mode are all valid measures of central tendency, but under different conditions, some measures of central tendency become more appropriate to use than others. In the following sections, we will look at the mean, mode and median, and learn how to calculate them and under what conditions they are most appropriate to be used.
#Mean (Arithmetic)
The mean (or average) is the most popular and well known measure of central tendency. It can be used with both discrete and continuous data, although its use is most often with continuous data (see our Types of Variable guide for data types). The mean is equal to the sum of all the values in the data set divided by the number of values in the data set. So, if we have n values in a data set and they have values x1,x2, …,xn, the sample mean, usually denoted by x¯ (pronounced "x bar"), is:
(x1+x2+ …+xn)/n
#Median
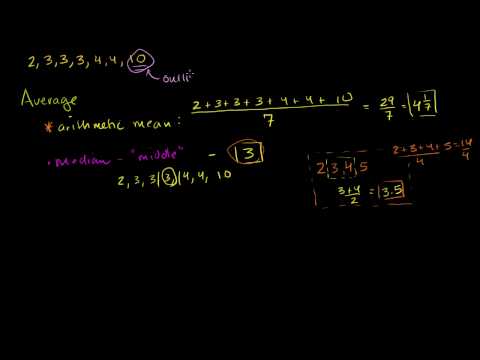
The median is the middle score for a set of data that has been arranged in order of magnitude. The median is less affected by outliers and skewed data. In order to calculate the median, suppose we have the data below:
65,55,89,56,35,14,56,55,87,45,92
We first need to rearrange that data into order of magnitude (smallest first):
14,35,45,55,55,56,56,65,87,89,92
Our median mark is the middle mark - in this case, 56. It is the middle mark because there are 5 scores before it and 5 scores after it. This works fine when you have an odd number of scores, but what happens when you have an even number of scores? What if you had only 10 scores? Well, you simply have to take the middle two scores and average the result. So, if we look at the example below:
65,55,89,56,35,14,56,55,87,45
We again rearrange that data into order of magnitude (smallest first):
14,35,45,55,55,56,56,65,87,89
Only now we have to take the 5th and 6th score in our data set and average them to get a median of 55.5.
#Mode
The mode is the most frequent score in our data set. On a histogram it represents the highest bar in a bar chart or histogram. You can, therefore, sometimes consider the mode as being the most popular option.
Introduction
A measure of central tendency is the use of a single value to describe a set of data by identifying the central position within that set of data. As such, measures of central tendency are sometimes called measures of central location. They are also classed as summary statistics. The mean (often called the average) is most likely the measure of central tendency that you are most familiar with, but there are others, such as the median and the mode.
The mean, median and mode are all valid measures of central tendency, but under different conditions, some measures of central tendency become more appropriate to use than others. In the following sections, we will look at the mean, mode and median, and learn how to calculate them and under what conditions they are most appropriate to be used.
#Mean (Arithmetic)
The mean (or average) is the most popular and well known measure of central tendency. It can be used with both discrete and continuous data, although its use is most often with continuous data (see our Types of Variable guide for data types). The mean is equal to the sum of all the values in the data set divided by the number of values in the data set. So, if we have n values in a data set and they have values x1,x2, …,xn, the sample mean, usually denoted by x¯ (pronounced "x bar"), is:
(x1+x2+ …+xn)/n
#Median
The median is the middle score for a set of data that has been arranged in order of magnitude. The median is less affected by outliers and skewed data. In order to calculate the median, suppose we have the data below:
65,55,89,56,35,14,56,55,87,45,92
We first need to rearrange that data into order of magnitude (smallest first):
14,35,45,55,55,56,56,65,87,89,92
Our median mark is the middle mark - in this case, 56. It is the middle mark because there are 5 scores before it and 5 scores after it. This works fine when you have an odd number of scores, but what happens when you have an even number of scores? What if you had only 10 scores? Well, you simply have to take the middle two scores and average the result. So, if we look at the example below:
65,55,89,56,35,14,56,55,87,45
We again rearrange that data into order of magnitude (smallest first):
14,35,45,55,55,56,56,65,87,89
Only now we have to take the 5th and 6th score in our data set and average them to get a median of 55.5.
#Mode
The mode is the most frequent score in our data set. On a histogram it represents the highest bar in a bar chart or histogram. You can, therefore, sometimes consider the mode as being the most popular option.

Mean, Median, and Mode: Measures of Central Tendency: Crash Course Statistics #3
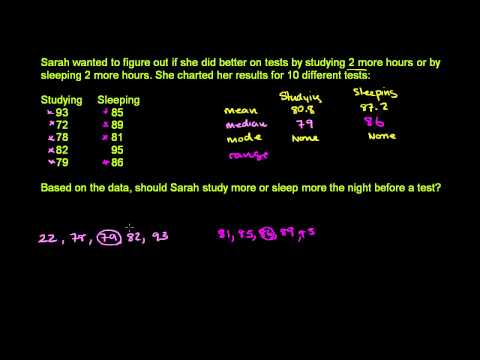
Measures of Center (mean, median, mode)

Choosing Best Measure of Center
Measures of Center

Measures of Central Tendency (Mean, Median, Mode)

Mean, Median, and Mode of Grouped Data & Frequency Distribution Tables Statistics

What is Central Tendency – An Introduction to Mean, Median, and Mode in Statistics (5-1)
Average or Central Tendency: Arithmetic Mean, Median, and Mode

Unlocking the Power of Data: Your Gateway to Data Analytics | Poonam Jaswani

Measure of Central Tendency - What? Why? How? || Mean || Median || Mode || Statistics for Beginners

Measures of Central Tendency and Dispersion

Statistics | Measure of Central Tendency

Measure Central Tendency : Mean-Median-Mode and Range

Mode, Median, Mean, Range, and Standard Deviation (1.3)

Measures of Central Tendency (1 of 2: Which to choose?)

Best Measure of Central Tendency - How to Choose and How to JUSTIFY Your Choice!

Mean, Median, Mode, and Outliers: Measures of Central Tendency

Math Antics - Mean, Median and Mode

Measure of Central Tendency of Grouped Data for beginners

Examples of Finding the Measures of Central Tendency - Mean, Median and Mode

Measures of Central Tendancy

Measure of Central Tendency || Lesson 1 || Probability & Statistics || Learning Monkey ||

Grade 10 Math: Measures of Central Tendency | Statistics

Rapid Learning: Statistics - What is Central Tendency & Variability?
Комментарии