filmov
tv
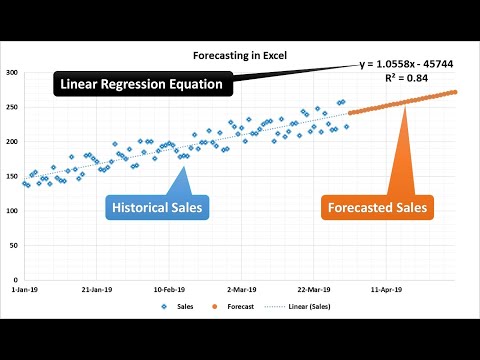
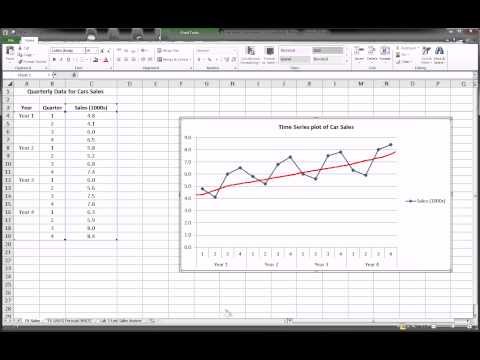
Trend Projections- using the Least Squares Technique + example in Microsoft Excel

Показать описание
This video discusses Trend Projections using the Least Squares Technique. The Least Squares technique is a time series forecasting method that uses historical data points and then projects the line into a future forecast. We will learn to calculate the slope (b) and y-intercept (a). We will also go over how to calculate a forecast using Least Squares, and then conclude the video with an example in Microsoft Excel. Content derived from from the Textbook "Operations Management, Sustainability and Supply Chain" 13th edition by Jay Heizer, Barry Render and Chuck Munson. Chapter 4 on Forecasting.
 0:12:02
 0:05:25
 0:05:31
 0:20:57
 0:11:21
 0:11:23
 0:12:44
 0:09:27
 0:03:10
 0:19:33
 0:13:32
 0:02:28
 0:24:05
 0:21:34
 0:09:10
 0:02:32
 0:09:28
 0:13:15
 0:15:02
 0:16:22
 0:02:39
 0:18:06
 0:07:02
 0:20:08