filmov
tv
Probability Sample Space & Tree Diagrams | Beard Squared

Показать описание
ABOUT THIS VIDEO:
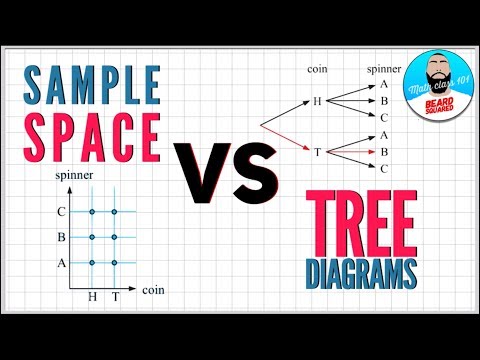
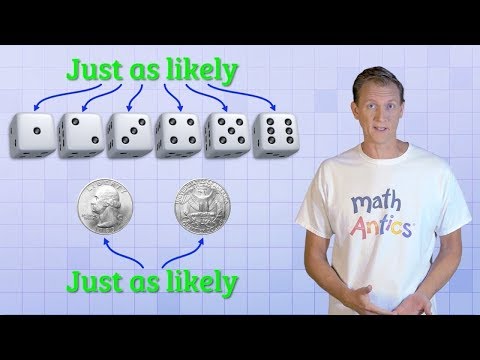
In this video, we explore the three different sample space methods including; lists, grids, and tree diagrams. The sample space of an experiment is the set of its possible outcomes.
Listing Outcomes: the simplest way to represent a sample space is to list the possible outcomes in set notation.
Grids: A grid or array is an efficient way to represent the sample space of an experiment involving two operations. Each point on the grid represents a possible outcome.
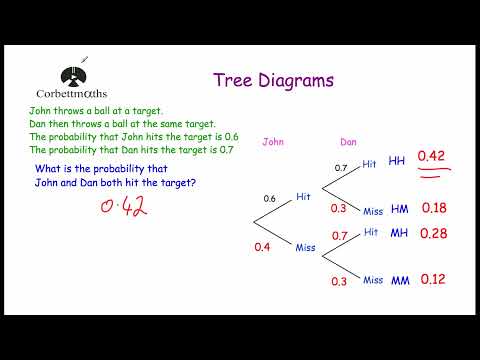
Tree Diagrams: The advantage of tree diagrams is that they can be used when more than two operations are involved.
CHECK OUT:
----------
Thanks for Watching!
Like, Comment & Share!
---------
If YOU want to make videos like us CHECK OUT
----------
GET TO KNOW ME:
In this video, we explore the three different sample space methods including; lists, grids, and tree diagrams. The sample space of an experiment is the set of its possible outcomes.
Listing Outcomes: the simplest way to represent a sample space is to list the possible outcomes in set notation.
Grids: A grid or array is an efficient way to represent the sample space of an experiment involving two operations. Each point on the grid represents a possible outcome.
Tree Diagrams: The advantage of tree diagrams is that they can be used when more than two operations are involved.
CHECK OUT:
----------
Thanks for Watching!
Like, Comment & Share!
---------
If YOU want to make videos like us CHECK OUT
----------
GET TO KNOW ME:
 0:16:59
Introduction to Probability, Basic Overview - Sample Space, & Tree Diagrams
 0:02:49
Tree diagram probability examples,
 0:32:52
Probability Tree Diagrams
 0:04:19
Probability Sample Space & Tree Diagrams | Beard Squared
 0:05:48
Probability of Complementary Events & Sample Space
 0:04:36
Probability - Sample space diagrams
 0:07:58
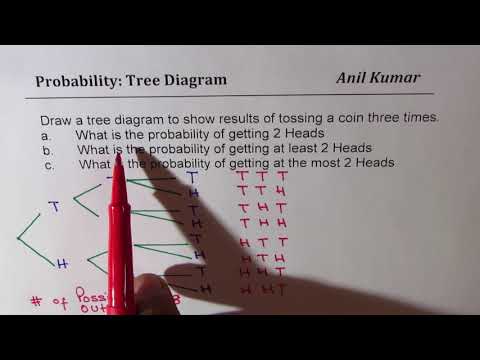
Probability Tossing Three Coins Tree Diagram At Least 2 Heads
 0:02:01
How to find the Sample Space in Probability
 0:07:36
Probability Trees (1 of 2: How to construct them)
 0:03:19
Probability Tree Diagrams : removing items without replacement
 0:10:40
Probability Tree Diagrams
 0:06:36
Probability Sample Space
 0:03:09
Sample Spaces | Statistics & Probability | Maths | FuseSchool
 0:02:42
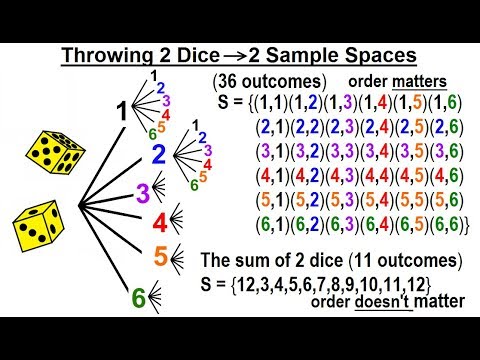
Statistics: Ch 4 Probability in Statistics (24 of 74) Throwing 2 Dice: 2 Sample Spaces
 0:19:14
Bayes' Theorem of Probability With Tree Diagrams & Venn Diagrams
 0:00:57
Probability: Sample Space Diagram From Two Outcomes (Spinners) (Grade 3) - GCSE Maths Revision
 0:11:28
Math Antics - Basic Probability
 0:04:51
S10 Tree Diagram Probability For Tossing Three Coins
 0:11:08
Tree Diagrams - Corbettmaths
 0:10:02
Multiplication & Addition Rule - Probability - Mutually Exclusive & Independent Events
 0:01:54
Probability - Sample Space
 0:04:16
Sample Space
 0:12:18
Probability Tree Diagrams
 0:22:46
Sample Spaces | Probability |
Комментарии