filmov
tv
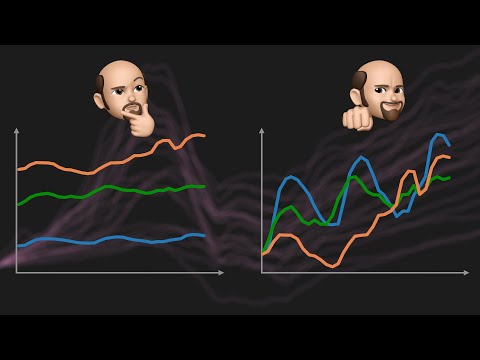
Index Charts, Part 2: Chopping Up and Folding the Time Axis

Показать описание
Index Charts that transform the vertical axis are pretty common, but what about indexing on the time axis? That's actually done quite a bit too, even though it's not always obvious. I talk about what indexing on the time axis means, discuss regular and irregular time indexing, and show examples from home price data, camera sales, climate change, and more.
00:00 – Intro
01:17 – Age as Index
01:43 – Regular vs. Irregular Time Indexing
03:02 – Camera Sales Data Example
03:40 – Running Data Example
04:12 – Climate Change Data Example
04:38 – Irregular Time Indexing, Bear Markets
05:37 – Market Penetration Example
06:22 – Making Time Index Charts in Software
06:47 – Closing
 0:07:39
Index Charts, Part 2: Chopping Up and Folding the Time Axis
 0:07:42
Index Charts, Part 1: Making Time Series Data Comparable
 0:00:06
Candlestick Chart Pattern #shorts #
 0:00:16
Extreme Cupping Therapy! #shorts #cupping
 0:00:14
Tips to cut paper in the shape of maple leaves are very simple
 0:00:30
Can You Reattach a Severed Finger? 🤔
 0:00:26
Skin Graft
 0:00:13
Inspire Award Project | A Problem Solving Idea For Farmers | Full Video Link in Description #shorts
 0:00:14
Toe Amputation
 0:00:21
heart ❤️ shape notebook divider #craft #notebook #heart #diy #crafts #schoollife #schooltime #shorts...
 0:00:15
Classroom Chart on Nouns
 0:03:12
Chop zone indicator strategy in hindi hop zone indicator Stock market indicator #stockmark
 0:00:26
Teddy bear shape cutting #shorts
 0:00:41
Experiment to show #TURMERIC (#Haldi ) as a Natural #Indicator..! #red #colour in #detergent (base)
 0:00:31
Hydrophobic Club Moss Spores
 0:00:17
diy book mark. credit to the real owner. not my video
 0:00:33
Did you know the full form of NEWSPAPER??
 0:00:16
Perfect Cut ✂️: A Letter with Inner Trick 🅰️ #chanafavors #diy #crafts #lettercutting #papercraft...
 0:00:26
GTA V FRANKLIN HAVE BIG BIRD FRIEND #shorts | Maheshwar Gamerz
 0:00:54
Choppiness index indicator || how to avoid sideways market || #shorts
 0:00:29
What Is Dandruff, Really? 🤔
 0:00:16
Easy Paper Flower Making Idea | How To Make 5 Petal Paper Flower | Paper Flower Craft #shorts #diy
 0:00:15
Diy paper game make it Homemade # shorts # Youtube # papergame # game # Youtube shorts
 0:00:25
Book cover design 🤗💙💜️❤️🔥 mini book part 2 #diy #satisfying #craft #shorts
Комментарии