filmov
tv
Monitoring Server Power Usage and Cost with Grafana | and How to create the graphs

Показать описание
In this video we will show how to monitor server power usage with grafana. We will also graph cost and wattage.
 0:12:22
Monitoring Server Power Usage and Cost with Grafana | and How to create the graphs
 0:09:07
Using Prometheus and Grafana for Monitoring my Power Usage
 0:01:00
Monitoring The Power Consumption Of A Server QuickTips
 0:04:53
Best Open-Source Network Monitoring Tools 2024
 0:10:13
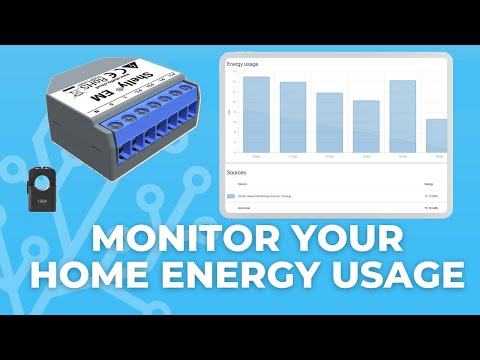
Energy Monitoring with Home Assistant
 0:24:36
Server Monitoring // Prometheus and Grafana Tutorial
 0:10:11
01 - SQLMonitor - Dashboard - Monitoring All Servers
 0:01:07
Data center redundancy and monitoring
 0:05:01
Free Power Toys for Your Linux Server!
 0:16:39
Which Smart Energy Monitor Is Right For You? ShellyEM vs Sense
 0:08:39
Monitoring House Power Consumption with ESP32 and Shelly Power Meter
 0:14:41
Monitoring memory and processor usage on Ubuntu Server
 0:29:01
BEST Home Server Monitoring Setup! (Linux, Proxmox, Unraid, and more)
 0:01:12
Electrical Power Consumption Limiter and Usage Monitoring
 0:32:38
MRMCD2024 Power efficency of (modern) servers
 0:23:57
Best Server Monitoring with Prometheus and Grafana using Node Exporter and cAdvisor
 0:08:05
Your ISP is lying! Monitor your Internet with a Pi
 0:17:38
COMPLETE power monitoring for your home!
 0:12:26
Power monitoring 16 circuits at the breaker panel
 0:18:45
Home power monitoring using the Shelly EM with Grafana, InfluxDB, Node-RED and MQTT
 0:08:50
Energy monitoring with Shelly EM and Home Assistant
 0:02:19
Linking to External Files from Power Monitoring Expert Vista | Schneider Electric Support
 0:04:32
Grafana Explained in Under 5 Minutes ⏲
 0:11:07
Your Old PC is Your New Server
Комментарии