filmov
tv
One Way ANOVA - Part 2 (one way analysis of variance - ANOVA)

Показать описание
One Way ANOVA in SPSS - Part 2 (one way analysis of variance - ANOVA). Learn how to conduct the one-way analysis of variance test in this video, including running the anova in spss and interpreting the results.
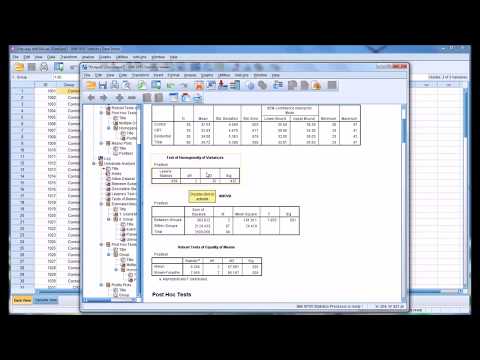
Video Transcript: the one-way ANOVA. To run the one way ANOVA, we want to go to Analyze and then Compare Means and then select the last option down there, One-Way ANOVA. And the One-Way ANOVA dialog box opens and what we want to do is put our dependent variable, the exam scores, into the Dependent List, and we want to put volume, our independent variable, into the Factor box. And recall that I said that the independent variable in ANOVA can also be called a factor, so that's where this term comes from. OK next we want to go to Options, and then select Descriptive, and then click Continue. And then one more thing we want to do is click on Post Hoc. Under Post Hoc, let's select Tukey. And I'll talk about post hoc tests, such as what they are, when we use them, and so forth, when we discuss our results in just a little while. One other thing worth mentioning here, the default level for the significance level is .05, and since we're using alpha .05, that's what we want to leave this at. If we were going to use alpha of .01, then we would want to change this accordingly. But since we're using .05, we'll leave it as it is. Next click Continue. And then everything looks good here, so let's click OK. And as we do that, our output or viewer window opens. And we have a few tables here. First of all, we have the Descriptives table, and we'll just take a quick glance at that. Notice our three groups here and once again remember the labels are output here, because I created value labels. There are 10 people in each group, this looks good. And notice here no music and low-volume both have means and the 84s, no music 84.9, low-volume 84.2. Whereas the high volume group had a mean at 77.5. So this group, at least in the sample, is definitely lower than these two groups, with the no music group having the best exam performance overall. Now this is just describing the results in the sample; we don't know whether these results are significant yet or not. We'll take a look at that next. Next, we go to our ANOVA table, and this is where we get the results of whether or not the groups are significantly different from one another. That is, does the level of volume in the background played while studying have an impact on exam performance? And with the ANOVA we get an F value, instead of a t, which we got with the t test, but here we get an F, and most importantly as always we have our significance value, or our p-value, and this is what we want to assess to see whether or not the test is statistically significant. And as a reminder our decision rule for assessing this test is as follows using alpha .05, if p is less than or equal to .05, the test is significant, and this indicates that the test scores differ significantly somewhere between the groups. If p is greater than .05, on the other hand, the test is not significant, indicating that the test scores do not differ significantly between the groups. So we want to look at our p-value here, compare it to these two conditions, and see which of the two it falls into. So with a p of .019, it falls into the first condition, since it's less than equal to .05. Therefore, we will conclude that the test is significant, indicating that the test scores differ significantly somewhere between the groups. And we can write our results as follows: the level of volume of music played while studying had a significant impact on exam performance. And what this is saying is the background volume of music played did influence the exam performance. In other words, exam scores differed for different volume groups. And then we have our APA format and notice now we have an F instead of a t since we're using an F-test, which you can see right here. And next we put our degrees of freedom and these degrees of freedom come from this column right here in our table, where we have between groups 2, and within groups 27, and you see here 2, 27. So if you're using APA format, you want to use these two values in your written results. Next we have an F of 4.62 which, when rounding to two decimal places, you can see right here. And finally our p-value is .019, which is reported here in the p value column shown as Sig. And, as always, we could state that p is less than .05, instead of p is equal to .019, although reporting the exact p-value is more informative, and therefore is recommended.
Channel Description: For step by step help with statistics, with a focus on SPSS. Subscribe today!
ANOVA in SPSS
one-way ANOVA - SPSS
analysis of variance in SPSS
SPSS ANOVA video
ANOVA
one way ANOVA
ANOVA in SPSS
Analysis of Variance in SPSS
 0:06:51
One-Way ANOVA
 0:10:50
One-Way ANOVA
 0:07:39
ANOVA 1: Calculating SST (total sum of squares) | Probability and Statistics | Khan Academy
 0:05:44
Introduction to One-Way ANOVA
 0:07:42
One-way ANOVA and Post Hoc Test Using SPSS
 0:10:21
One-way ANOVA & Post-Hoc Analysis in Excel
 0:12:49
ANOVA - One-Way (part 1 of 4)
 0:08:38
One-Way ANOVA: LSD confidence intervals
 1:14:06
Class 11: Generalized Measurement Models (Lecture 04a, part 1, Bayesian Psychometric Models, F2024)
 0:04:46
ANOVA - Part 1 (One-way Analysis of Variance)
 0:13:31
ANOVA: One-way analysis of variance
 0:11:20
How to do a One-Way ANOVA in SPSS (12-6)
 0:13:29
What is ANOVA (Analysis of Variance) in Statistics ? | Explained with Examples (ANOVA F - test)
 0:16:28
How To... Perform a One-Way ANOVA Test (By Hand)
 0:05:04
One-Way Between Groups ANOVA - SPSS
 0:12:48
Chapter 4.2: One Way ANOVA (part 1)
 0:04:52
Finding the P-value in One-Way ANOVA
 0:00:38
Anova f statistic ? #anova #statistics #onewayanova #statisticsclass
 0:09:06
One-Way ANOVA: The Formulas
 0:02:21
4. One-Way Anova Table
 0:14:21
Hypothesis testing with One-Way Between Groups ANOVA: Part 1
 0:09:34
Single Factor ANOVA, Part 1
 0:05:26
A One-Way ANOVA Example
 0:11:31
How To... Perform a One-Way ANOVA Test in SPSS
Комментарии