filmov
tv
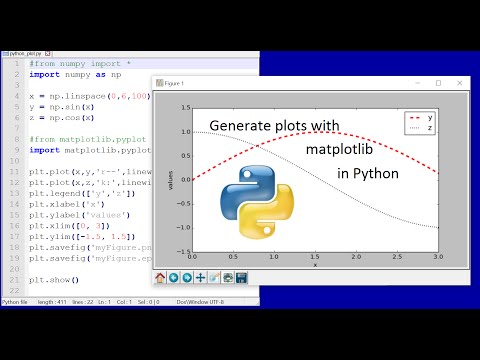
Generate Python plots with matplotlib

Показать описание
Plots are an important way to convey information in presentations and technical papers. High quality plots can be generated in Python with matplotlib and saved in a variety of file formats for import.
 0:09:20
Generate Python plots with matplotlib
 0:06:25
Python Data Science Tutorial #10 - Scatter Plots with Matplotlib
 0:06:43
Learn Matplotlib in 6 minutes | Matplotlib Python Tutorial
 0:00:41
How To Plot Pandas Dataframe Using Matplotlib | Python For Beginners
 0:03:54
HOW TO USE Matplotlib in 4 MINUTES (2020 Python Tutorial)
 0:12:33
Polar Plots in Python with Matplotlib
 0:20:34
Matplotlib Tutorial (Part 9): Plotting Live Data in Real-Time
 0:08:33
How to Make a Surface Plot in Python - Matplotlib
 0:03:53
Python plotting with matplotlib (Part 2): Make a Plot with Two Different Y-axis in Python
 0:00:32
Create a graph using python.|| python.|| Numpy .|| Matplotlib.||beginnerscode.
 0:07:07
Python Data Science Tutorial #11 - 3D Plotting with Matplotlib
 0:00:45
Creating a Real-Time Matplotlib Scatter Plot in Python in 1 Minute
 0:17:24
Professional 3D Plotting in Matplotlib
 0:11:09
MATPLOTLIB 3D PLOTS including Scatter 3D and Surface Plots for Matplotlib Python || Matplotlib Tips
 0:09:47
Introduction to Line Plot Graphs with matplotlib Python
 0:00:31
Bar plot using python matplotlib.
 0:05:57
Hex Bin Plots With Matplotlib - Pandas For Machine Learning 24
 0:00:51
Plot Graph in Python using Matplotlib🔥 | #shorts #matplotlib #python
 0:10:17
Animating Plots In Python Using MatplotLib [Python Tutorial]
 0:13:47
How to: Plot a Function in Python
 0:08:05
How to make a chart with 3 y-axes using matplotlib in python
 0:19:13
Python Tutorial for Beginners #13 - Plotting Graphs in Python (matplotlib)
 0:00:35
How to make Line plot || matplotlib || python
 0:09:53
Matplotlib Scatter Plots | Creating Scatter Plots with Python for Data Science and Geoscience
Комментарии