filmov
tv
How to create a grouped bar chart in R with ggplot2's geom_col and position_dodge functions (CC107)

Показать описание
A grouped bar chart plot can be an effective way to represent the variation across a continuous variable for multiple levels of two categorical variables. These plots can be made in R using the geom_col and position_dodge functions from the ggplot2 R package. Watch this episode where Pat will demonstrate how to create barplots. Although these are superior to stacked barcharts, there are still problems with barcharts that he will discuss in this episode of Code Club.
Do you have a figure that you would like to receive a critique or help improving? Let me know and I'd be happy to arrange a guest appearance!
You can also find complete tutorials for learning R with the tidyverse using...
0:00 Introduction
5:56 Creating a grouped barchart
8:38 Deciding Which variable to group by on x-axis
14:09 Changing the plot to use genus data
22:57 Critique and Recap
 0:12:43
How to construct a grouped frequency distribution
 0:02:35
How To Create A Group On Roblox
 0:01:09
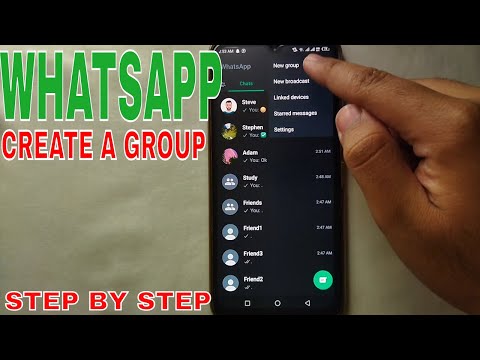
How to Create WhatsApp Group? (Quick & Easy!)
 0:01:30
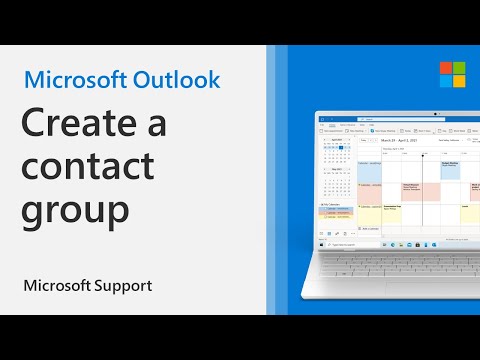
How to create a contact group in Outlook | Microsoft
 0:03:59
✅ How To Create A Group On WhatsApp 🔴
 0:01:57
How to Create Contact Group on your iPhone (2023)
 0:07:55
How to Create a Facebook Group and Leverage it to Your Advantage
 0:01:27
How To Create WhatsApp Group - Full Guide
 0:05:07
GROUP chat update on avakinlife 2024||How to create group on avakinlife 2024 ||
 0:01:36
How to create a group email address for your business in Microsoft 365
 0:02:41
HOW TO CREATE YOUR OWN GROUP IN ROBLOX FOR FREE WITH NO ROBUX!!! (2021)
 0:01:50
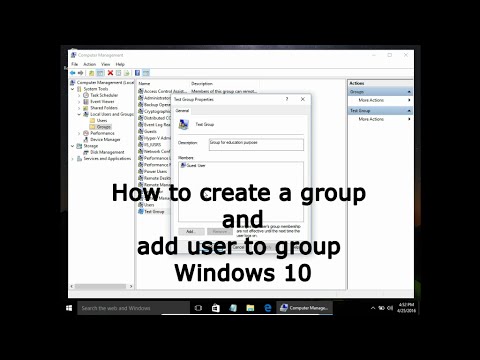
How to create a group and add user to group Windows 10
 0:07:09
Create A Grouped Product Within WooCommerce
 0:02:50
How To Create Facebook Group
 0:01:49
Create a contact group / distribution list in Outlook by Chris Menard
 0:01:52
How To Create A Group Email In Gmail :Tutorial
 0:08:13
Create A Grouped Product In WooCommerce
 0:02:05
How to create group in Microsoft Teams 2022
 0:01:57
How to create a group in Microsoft Teams
 0:09:59
How To Create A Facebook Group [2022]
 0:02:33
How To Create A LinkedIn Group? [in 2024]
 0:03:16
How To Create Group Chat On iPhone
 0:01:43
How To Create And Name A Group Text On iPhone 2024 | EASY & QUICK!
 0:01:45
How To Create A Group in Telegram (Start to Finish)
Комментарии