filmov
tv
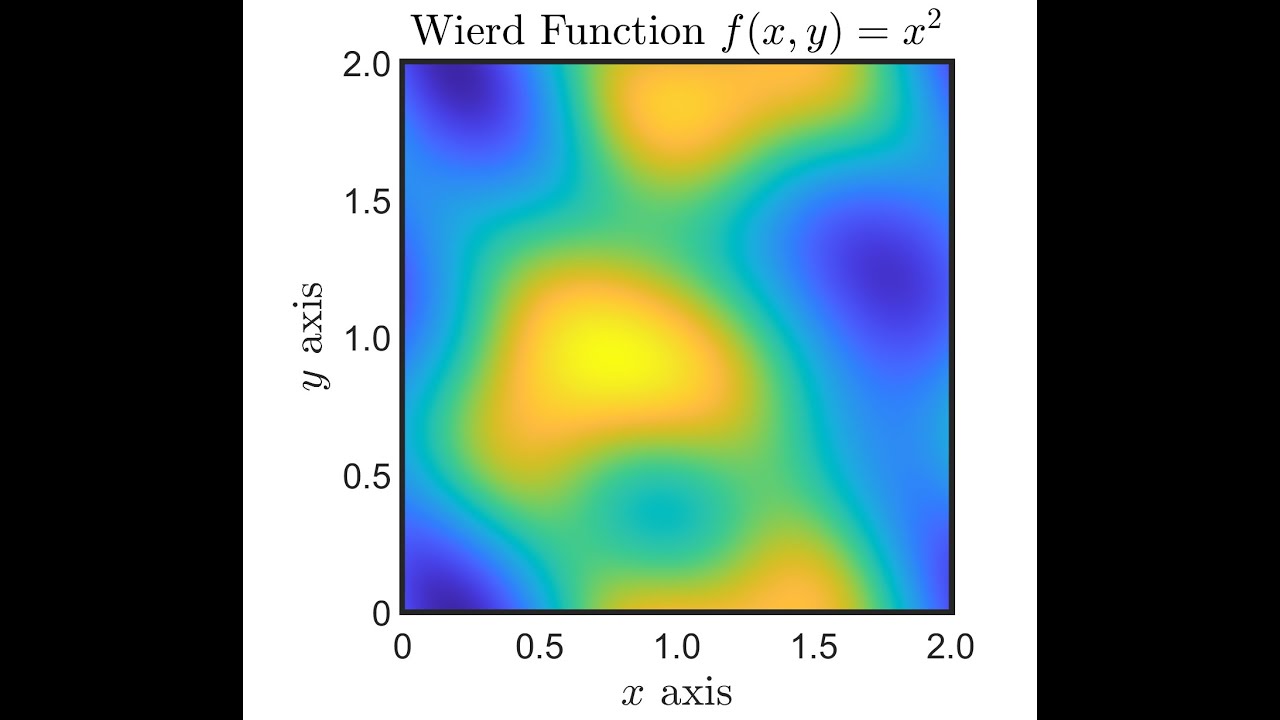
Generating Professional Two-Dimensional Graphics in MATLAB
Показать описание
This video shows the two main 2D function plotting functions imagesc() and pcolor() and goes on to show how to dress up plots in order to make professional graphics. As a bonus, a neat technique for generating a random 2D function is used to demonstrate the graphics techniques.
 0:27:50
Generating Professional Two-Dimensional Graphics in MATLAB
 0:14:06
How to Create a Two Dimensional Graph in Python
 0:10:15
Two-dimensional plots in Matlab
 0:02:20
D3.js in 100 Seconds
 0:10:10
Graph Display for Multi-dimensional Data in MATLAB
 0:27:37
Lecture - 08( Two Dimensional Plots in MATLAB)
 0:07:09
Science of Data Visualization | Bar, scatter plot, line, histograms, pie, box plots, bubble chart
 0:02:27
Graphing: Origin: Contour Plots and Color Mapping Part 1 - Create Contour Plot from a Matrix
 1:11:29
Enhancing 3D Brain MRI Visualization: Implementing Real-Time Rendering with Optimized Techniques
 0:17:24
Professional 3D Plotting in Matplotlib
 0:01:13
How to create a Grouped Bar chart using a dimension in Tableau
 0:05:51
How to make 2D Kernel Density Plot (Two Dimensional Density Graph) in OriginPro
 0:08:25
How to Create a Jira Dashboard in Under 10 Minutes
 0:01:46
Paired Comparison Plot App
 0:04:53
How To Create Bubble Chart in Excel | Bubble Ghraph In Microsoft Excel | DataWitzz
 0:00:22
Comment yes for more body language videos! #selfhelp #personaldevelopment #selfimprovement
 0:00:44
How much does a PHYSICS RESEARCHER make?
 0:08:10
How to Create Multi-Category Column/Bar Chart in Excel
 0:06:04
AUTOCAD ISOMETRIC DRAWINGS | CREATE 2D ISOMETRIC VIEWS IN AUTOCAD
 0:00:37
2D Motion Graphics | Inspiration Series
 0:34:10
Transformation in 2D: Translation|Scaling|Rotation|Reflection|Shearing with numericals
 0:03:44
How to Add MULTIPLE Sets of Data to ONE GRAPH in Excel
 0:00:54
More Intuitive Workflows for Creating and Editing Dimensions
 0:00:20
1st yr. Vs Final yr. MBBS student 🔥🤯#shorts #neet
Комментарии