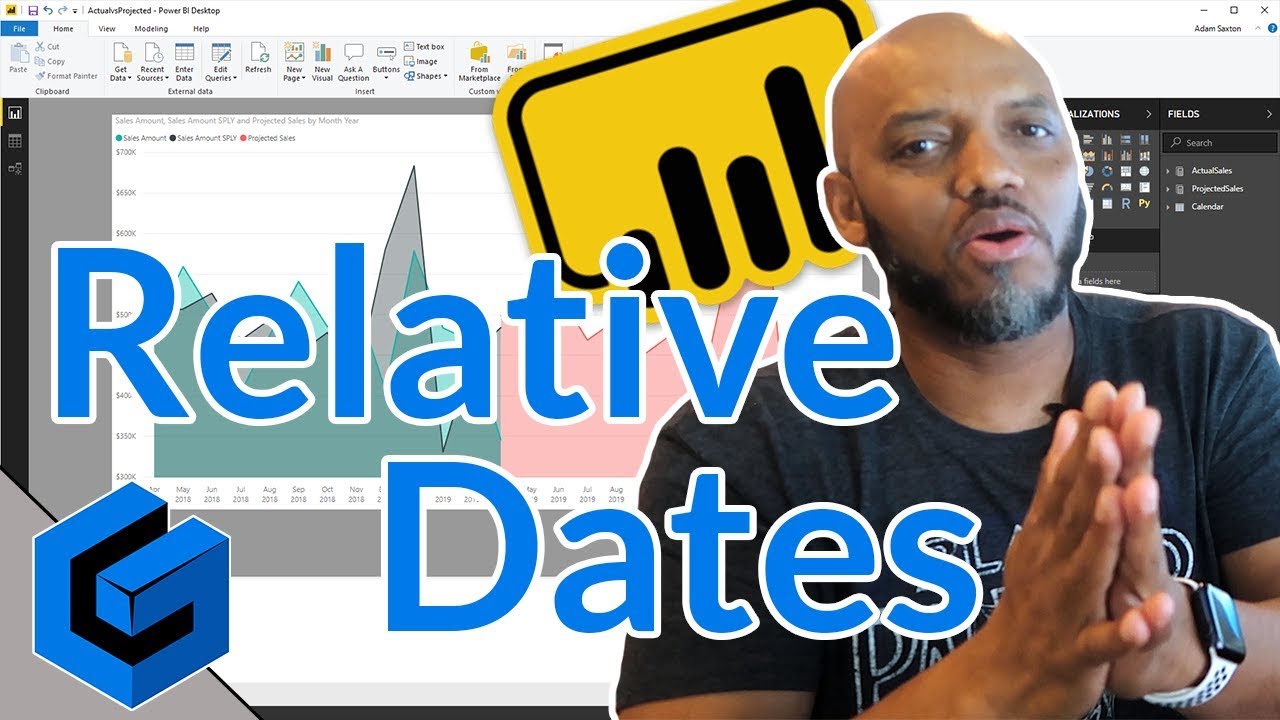
Power BI: Use DAX to get relative dates

preview_player
Показать описание
Patrick looks at how you can get relative dates, in Power BI Desktop, without using the relative date slicer or relative date filters. You just need to sprinkle a little DAX into Power BI Desktop to get this going!

********
LET'S CONNECT!
********

***Gear***

#PowerBI #RelativeDates #GuyInACube
Рекомендации по теме
Комментарии
Автор

I know this is a bit of an older video, but it helped me out today! I have a report that I need to always show the previous 365 days. So, for instance, today is Oct 31, 2023, so I need 11/1/22 through 10/31/23. I was using Relative Date to filter the last year, but Power BI defaults to UTC. In the last 5 hours of the day, it shows errors because it's trying to show based off of 11/1/23 because it's already tomorrow in UTC. This video helped me figure out how to overcome that with only a minor change to your code! I spent about an hour trying to figure it out, but for some reason a calculated column like this didn't occur to me. Great stuff, as always! I love learning from you fellas.

bcwest
Автор

Like the idea, though I think using "ABS ( DATEDIFF ( ... ) ) <= 12" should be more simple and run faster :D.

arklur
Автор

Hi Patrick! Perfect solution when you want to see data relative to some "fixed" date (max order date) that be refreshed at the same time as calculated columns but... when you need to change the date on the report, you need a measure that recalculates on the fly. For example a slicer to select Jan or Feb and the visualization shows 24M relative to selected month. In this cases I use a second "calendar" for the slicer and measures for the last n monts to fliter the visualizations. It would be great if you make a video about this. It's difficult to business developers to understand that calculated columns are not "dynamic" as measures. Thanks!!!!

paulasturla
Автор

This is a good tip in the power of having a custom dates table. I'm still manually flipping dates over each month in a few reports because I need to show X months in the past and X months into the future, it's not always the same amount on either side. I have done stuff like this before so this video is a good reminder to "be efficient". Seems like it would be a good feature request for the relative date filter.

Galahadoc
Автор

Funny I did similar workaround for customer last year that did similar approach. They wanted data filtered to when last rows were updated. Relative didn't work because weekends and long weekends/holidays data didn't update. This status column works a treat!

JorgeSegarra
Автор

Thank YOU This is an awesome guide! I spend a whole day searching on how I can dynamically filter cards to the latest reporting month!

dollisonjoseph
Автор

I use a similar technique for rolling x weeks as a calculated column on the calendar table. In some of my reports, the "x" in rolling x weeks can be set by the user using a slider. They love it.

jeremyfirth
Автор

Hey Patrick,


The "in Generate series"... was the ace in the hole. Keep going.
Peace

fcoatis
Автор

This was great! I was struggling to get my data to show my a full 2 months back and current month. The relative date filter would only do from like the 28th of furthest back month to now but this completely fixed that! Thank you!!!

SoulSlayer
Автор

Thanks for your great Video, I'm looking for a solution, which allows user to choose this interval .For example user can select that the chart shows last 3 or 6 or 9 Months, can it be implemented dynamically?

mahsasahargahi
Автор

Hey Patrick, very helpful. Tks for sharing. Question: how to compare month to day versus exactly same days in previous month excluding non working days and public holidays.

ayltonasc
Автор

Been using this concept for a year or two now, it's a godsend.

quinnmichael
Автор

Thank you! I was able to implement this for historical weather temps and forecasted temps. My intervals were in days. Great solution!

tylerbuckingham
Автор

Great solution - how could you use it to look back to the prior calendar month? Is there a DAX function for that?

deejohn
Автор

Hey Patrick, you always hace the asnwers to whatever problem I encounter on Power Bi, you guys are awesome. Thanks, Andy, Argentina.

awalpen
Автор

I have a question for you that is driving me crazy. I am fairly new to PowerBi and I cannot find the solution to my question ANYWHERE!

In one table I have the following columns; Job ID, YYYY-WW, Hours worked. I want to use a date table to help to consolidate this data. The source only has the data YYYYWW. I split and merged to get YYYY-WW but that's where my knowledge ends. I don't know what to search for for guidance. I want to be able to display graphs that shows hours worked each month by Job ID.

Many thanks all!

lazydrunk
Автор

Great solution. We do a lot of rolling calculations in our organization so I'm sure this will come in handy. Quick question - how do you keep all of your DAX functions straight? There are so many useful functions that I'm sure are under utilized.

sushicatsan
Автор

This is awesome Patrick! Thanks for sharing it - Can we do this dynamic ? Like Summary Page with Month & if we select May 2021 as Month value and drill through to detail - can we show this to render Prior 12 Month data on detail grid ? Is it possible ?

crackerzin-bi
Автор

Hi Patrick, it's great and I've adopted it in most of my BI reports now. Thanks!!!
Btw, would like to know if similar logic could be used at the Power Query of Excel, coz there's no generateseries there.
Your help is much appreciated.
Thanks, Raymond

himoray
Автор

Hi Patrick, Your videos are great and helpful. Is there a way to get the date to automatically pull the max date without having to get in and change the date slicer everyday?

wvajones