filmov
tv
Regression in Excel in 3 ways/Line of best fit

Показать описание
Most resort to statistical packages for regression like Stata or SPSS but Excel can do it very well and quite easily really. I explain methods here through charts, formulas or, for multivariate regression & extra related statistics the Analysis ToolPak does it nicely once enabled on your Excel program. This doesn't need a newer version of Excel, if you would like the workbook I used send a comment and subscribe to the channel.
Regression is similar to finding a line of best fit in the chart, and getting the slope and intercept of the chart, then checking how reliable it is using the R squared value.
00:00 - Introduction
01:55 - Regression explained
02:57 - Regression using formulas
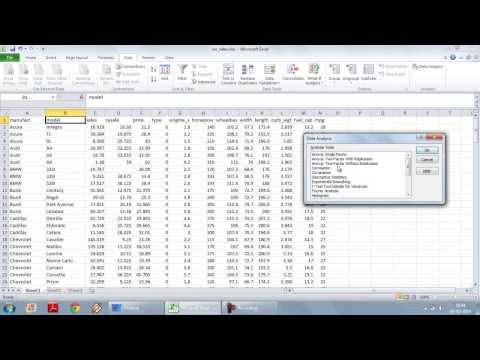
04:09 - Multiple variables
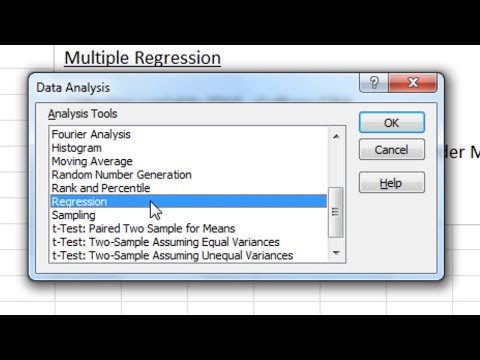
05:31 - Using the Analysis ToolPak
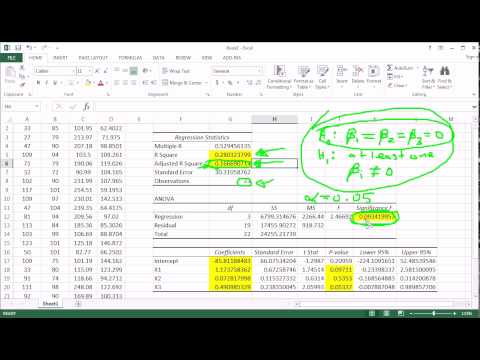
07:30 - Interpreting the summary output
09:40 - Enabling the Analysis ToolPak
Regression is similar to finding a line of best fit in the chart, and getting the slope and intercept of the chart, then checking how reliable it is using the R squared value.
00:00 - Introduction
01:55 - Regression explained
02:57 - Regression using formulas
04:09 - Multiple variables
05:31 - Using the Analysis ToolPak
07:30 - Interpreting the summary output
09:40 - Enabling the Analysis ToolPak
 0:06:33
Excel Multiple Regression
 0:10:59
Regression in Excel in 3 ways/Line of best fit
 0:08:06
Excel Linear Regression The EASY Way!
 0:07:15
Statistics VIII - Multiple Correlation and Regression
 0:05:18
How to do a linear regression on excel
 0:05:46
Using Excel for Regression Analysis
 0:05:05
Multiple Regression in Excel - P-Value; R-Square; Beta Weight; ANOVA table (Part 1 of 3)
 0:11:02
Multiple Regression in Excel
 2:00:36
Week-5|Summary session
 0:05:39
Multiple Regression in Excel - P-Value; R-Square; Beta Weight; ANOVA table (Part 3 of 3)
 0:05:28
Multiple Regression in Excel - P-Value; R-Square; Beta Weight; ANOVA table (Part 2 of 3)
 0:10:31
Fama French 3 Factor Model Regression in Excel
 0:13:55
Discussion 6: Using Multiple Regression in Excel for Predictive Analysis
 0:04:23
Linear Regression in Excel: How to Interpret a Model & Make Predictions
 0:18:49
Multiple Regression Explained with Excel
 0:04:37
Linear Regression in Excel
 0:12:21
Regression Analysis in Excel - It's Easier Than You Think (3 methods)
 0:15:00
Regression Analysis and Interpretation in Excel
 0:09:14
Multiple Linear Regression using Excel Data Analysis Toolpak
 0:10:18
How to handle categorical independent variable in multiple linear regression analysis in Excel
 0:06:33
Linear Regression in Excel
 0:33:47
Correlation and Multiple Regression in Excel
 0:04:12
Regression Method of Forecasting Using Microsoft Excel
 0:03:21
Regression Analysis on Excel
Комментарии