filmov
tv
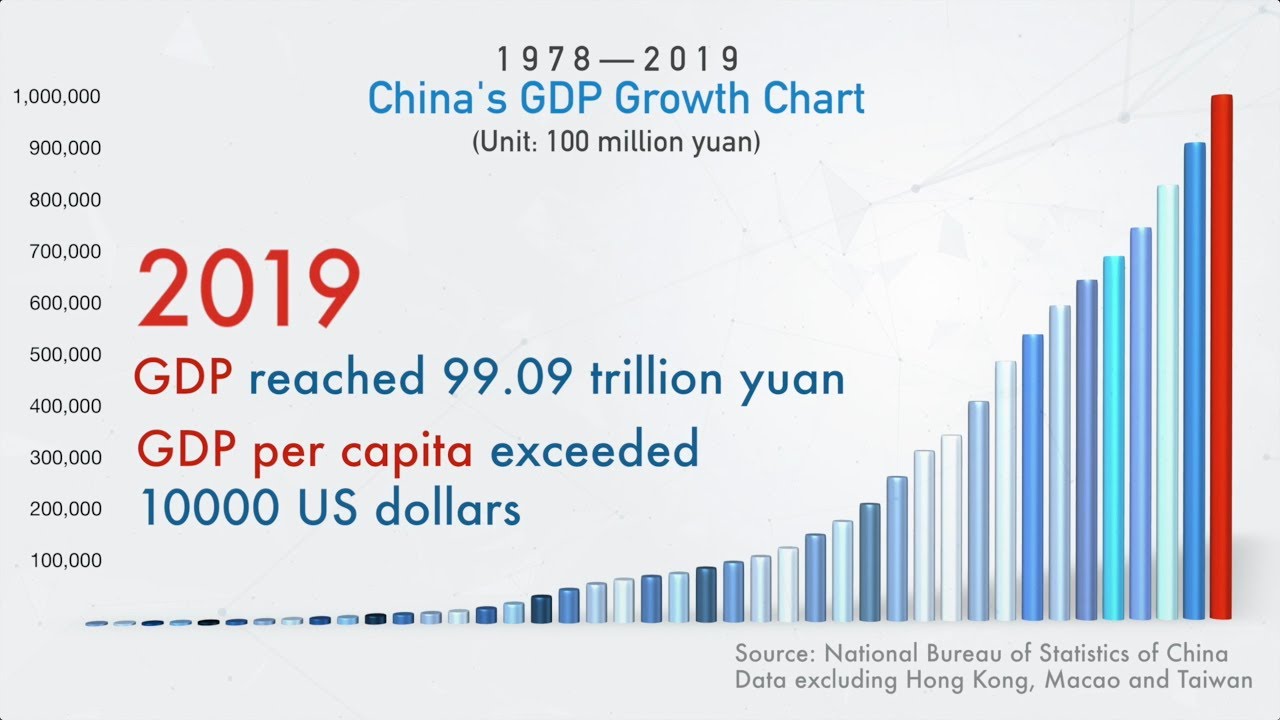
Dynamic graph of China's GDP growth in 42 years
Показать описание
In 2019, GDP reached 99.09 trillion yuan, and GDP per capita exceeded 10,000 U.S. dollars. Here is a dynamic graph showing China's GDP growth from 1978 to 2019.
Follow us on:
Follow us on:
 0:00:39
Dynamic graph of China's GDP growth in 42 years
 0:06:17
Top 20 Country GDP (PPP) History & Projection (1800-2040)
 0:01:25
How China became the world's second largest economy
 0:04:06
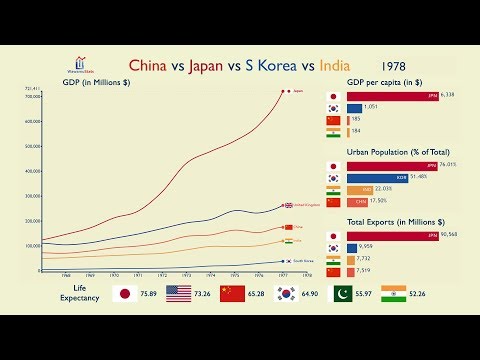
China vs Japan vs Korea vs India: Everything Compared (1960-2017)
 0:01:16
China's GDP hits record growth
 0:01:31
Dynamic charts Armenian Banking System and GDP
 0:01:00
China revises up 2018 GDP calculation
 0:07:40
Why China's population is shrinking
 0:03:21
Richest Asian Economies GDP Nominal 1960-2030 (In US$ Billions)
 0:25:35
Can China still become the world’s largest economy? | Business Beyond
 0:01:24
The Formula For Economic Growth | Intellections
 0:07:04
Japan vs China vs South Korea - Country Comparison 2024
 0:02:13
Why China lowered the GDP growth target in 2019?
 0:00:16
China GDP #country #history #China #GDP #map #flag
 0:00:26
Asia GDP 2023 / IMF, October 2023 Data
 0:00:25
China’s🇨🇳GDP 1928-1949#country#comparison #viral #trending#china #education#shorts#edit #education...
 0:01:54
China’s GDP growth is more solid than US’
 0:01:01
Biggest Asian Economies by GDP from 1960 to 2021.
 0:01:00
Shifting Tides: The Remarkable Evolution of Global GDP Share - Europe, USA, and China
 0:22:52
How Xi Jinping’s authoritarianism is killing China’s economy | Business Beyond
 0:03:07
What's behind China's 5.5% GDP growth target?
 0:00:26
G20 GDP 2023 / IMF, October 2023 Data
 0:10:51
The fake data of the Chinese economy: from GDP, import-export, to unemployment
 0:00:58
G20 GDP #g20 #racingbarchart
Комментарии