filmov
tv
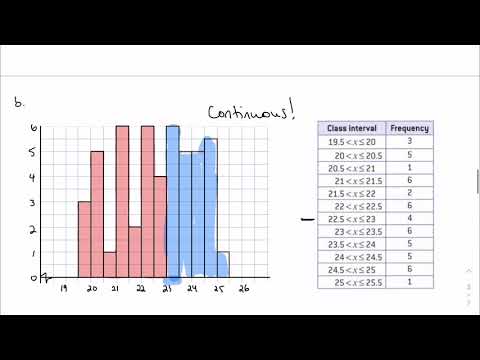
5.2, part 2: Histograms (IB Math AA HL 1)

Показать описание
Beginning to talk about how we are able to visualize data and analyze its spread. While histograms are very similar to bar graphs, they're more widely used in statistics and will come back when we discuss distribution in Year 2.
 0:22:18
 0:13:59
 0:04:59
 0:16:45
 0:08:41
 0:04:52
 0:08:49
 0:00:16
 0:30:52
 0:00:16
 0:00:22
 0:10:03
 0:01:00
 0:06:37
 0:00:11
 0:10:42
 0:00:15
 0:06:39
 0:04:51
 0:16:01
 0:03:49
 0:08:21
 0:08:25
 0:02:40