filmov
tv
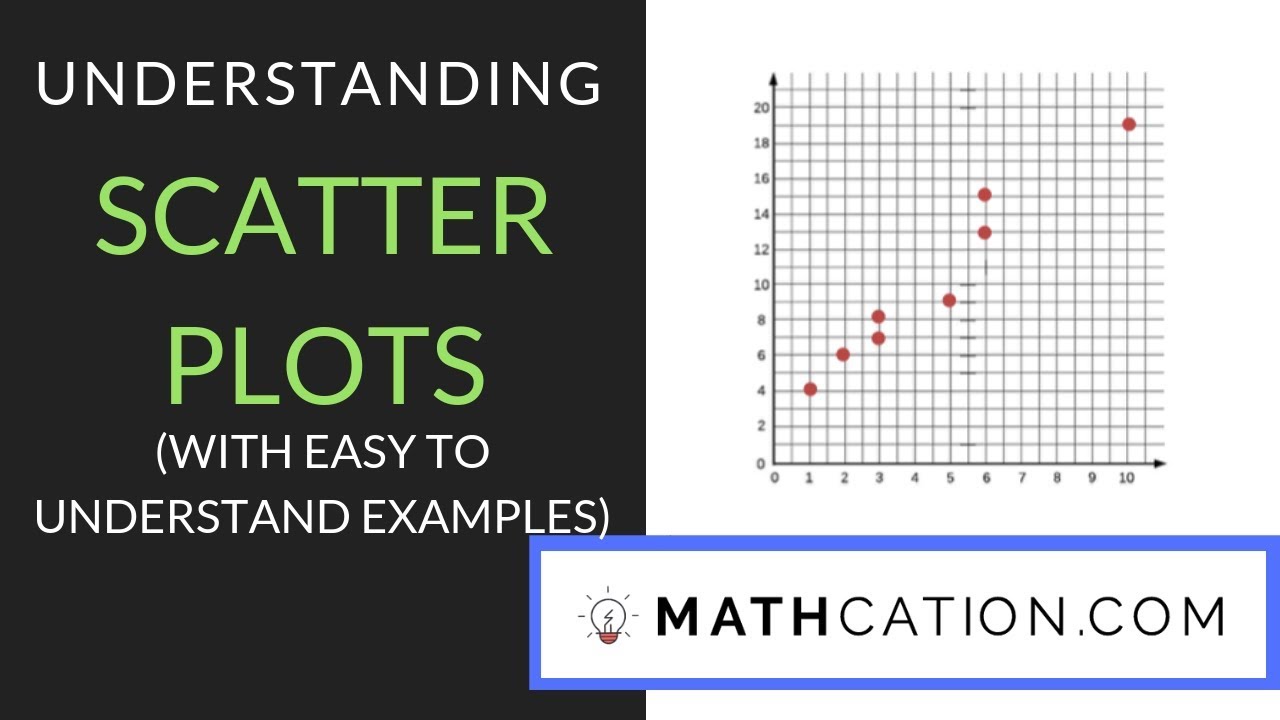
Scatter Plots | 8th Grade | Mathcation
Показать описание
Scatter Plots are graphic representations of the relationship between two variables. Scatter Plots are a good way to look at the correlation between the two variables. The correlation of a Scatter Plot can be three different things. There can be a positive correlation, a negative correlation, and no correlation. A positive correlation means that the variables are related in such a way that they behave similarly. A negative correlation means that the variables are oppositely related. No correlation means that the variables do not seem to have a correlation at all.
Common Core Standard: 8.SP.3
About Mathcation: Mathcation has hundreds of resources that are available 24/7. Our lesson outlines, worksheets, and quizzes are easy to follow and make math goals easily achievable. All materials are designed to flow flawlessly throughout the lesson and to ensure that all aspects of content have been covered. You can be sure that you’ll find all your math needs on Mathcation.
Mathcation is effective because we focus on real questions and examples that students face on standardized tests. Our resources provide questions and examples of varying levels of difficulty, from beginner all the way to mastery. We always make sure we cover all levels of understanding for each topic.
 0:06:47
Scatter Plots | 8th Grade | Mathcation
 0:04:51
Scatter Plots, Association and Correlation
 0:04:08
Constructing Scatter Plots | 8th Grade Math Pre-Algebra
 0:01:04
Scatterplots — Basic example | Math | SAT | Khan Academy
 0:02:52
Scatter Graphs: What are they and how to plot them
 0:05:00
8th Grade Math Scatterplots
 0:17:23
Statistics - Scatter Plots: 8th grade math
 0:15:29
4-5: Scatter Plots and Lines of Fit (8th Grade)
 0:03:22
1-6: Scatter Plots (7th Grade)
 0:04:17
8th grade Math - Scatter Plots
 0:02:45
Year 8 maths: scatter graphs
 0:21:50
Scatter Plots (8th Grade)
 0:14:17
💗 The Meaning Behind Scatter Plots Video ---Grade 8 Middle School Math from The Magic of Math
 0:04:58
Scatter Plots and Associations | 8th Grade Math Pre-Algebra
 0:07:16
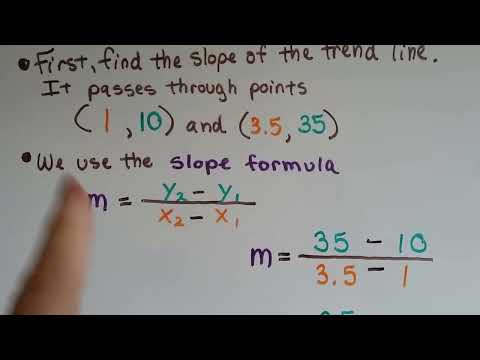
Grade 8 Math #14.2b, Scatter Plot - Find equation from Trend line
 0:13:32
8th Grade Math: Constructing Scatterplots
 0:02:26
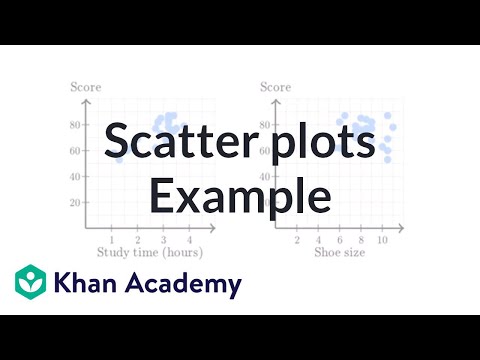
Studying, shoe size, and test scores scatter plots | Probability and Statistics | Khan Academy
 0:06:03
Statistics - Making a scatter plot
 0:04:23
Interpret a scatter plot by identifying clusters and outliers
 0:03:31
Scatter Graphs: Correlation
 0:03:43
Grade 8 Math #14.2a, Drawing a Trend Line on a Scatter plot
 0:13:01
8th Grade Module 11 Lesson 1 – Scatter Plots
 0:05:05
Scatter Plots | Grade 8 Math | Oryx Learning
 0:08:02
Bivariate Data and Scatter Plots 8th Grade
Комментарии