filmov
tv
8th grade Math - Scatter Plots

Показать описание
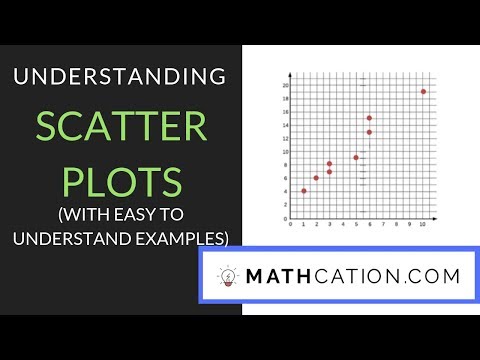
8th grade Math tutorial on how to graph bivariate data from a table and see that the data is a scatter plot. The video also covers recognizing outliers and clusters and determining if the scatter plot is positive, negative or has no relationship.
TEKS 8.11A
Other content related to this video:
TEKS 8.11A
Other content related to this video:
 0:06:47
 0:04:17
 0:04:08
 0:01:04
 0:04:51
 0:02:45
 0:02:52
 0:14:17
 0:04:58
 0:12:28
 0:17:23
 0:21:50
 0:07:16
 0:15:29
 0:04:36
 0:03:09
 0:10:17
 0:05:05
 0:00:27
 0:04:40
 0:06:45
 0:03:01
 0:16:41
 0:02:26