filmov
tv
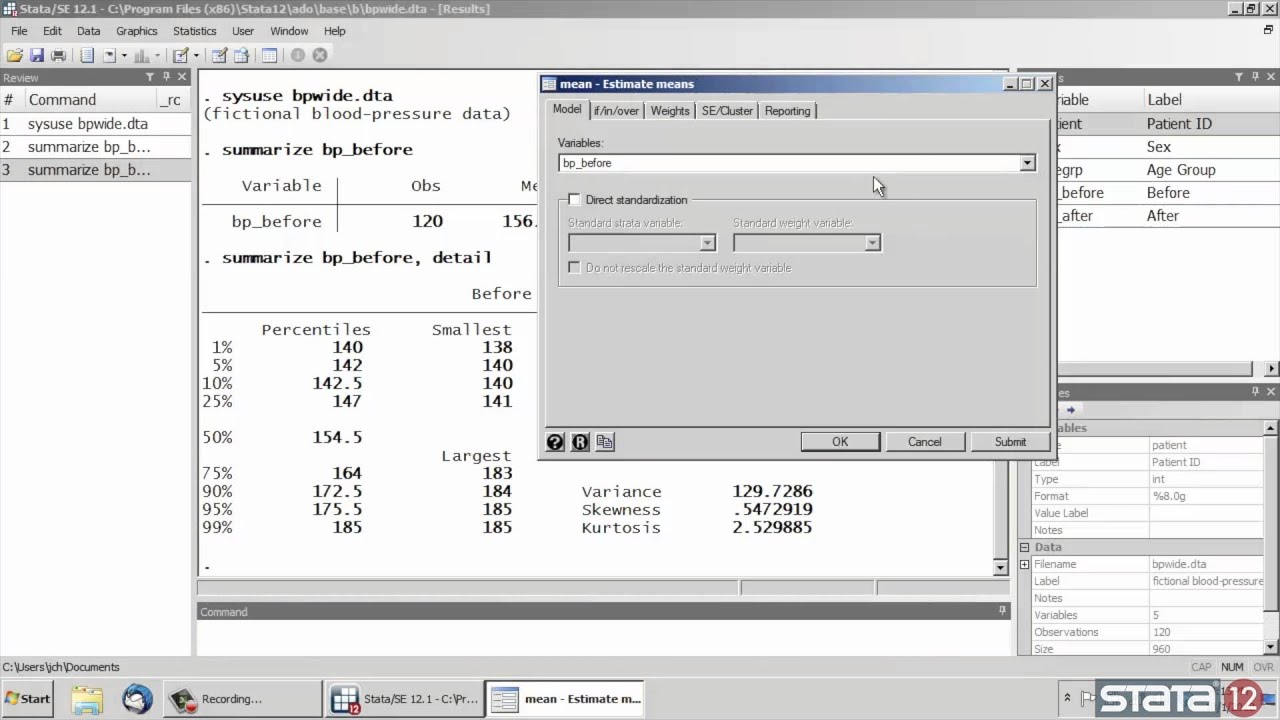
Descriptive statistics in Stata®
Показать описание
Learn how to obtain descriptive statistics for continuous variables in Stata.
If you have trouble finding the *tabstat* command, try typing *db tabstat* into the Command window.
Also check out the *dtable* command introduced in Stata 18:
Copyright 2011-2019 StataCorp LLC. All rights reserved.
If you have trouble finding the *tabstat* command, try typing *db tabstat* into the Command window.
Also check out the *dtable* command introduced in Stata 18:
Copyright 2011-2019 StataCorp LLC. All rights reserved.
 0:06:19
Descriptive statistics in Stata®
 0:08:16
Descriptive Statistics in Stata
 0:01:11
New in Stata 18: Creating and exporting tables of descriptive statistics
 0:10:15
Using Stata Creating a Table of Descriptive Statistics
 0:10:53
Descriptive Statistics all Commands in STATA | Road to PhD
 0:04:05
Descriptive statistical analysis in STATA
 0:00:37
How to do Descriptive statistics on timeseries dataset using stata
 0:09:42
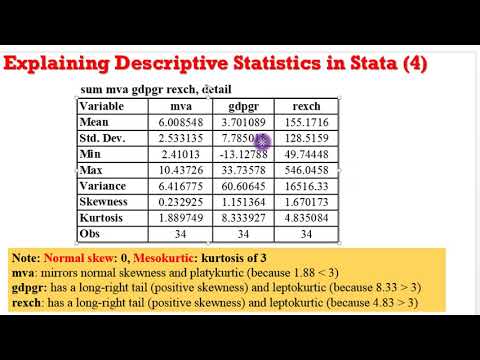
(Stata13):Interpret Descriptive Statistics #descriptivestats #interpret #stata #output
 0:05:56
Stata Lecture 6: Generating Summary Statistics
 1:43:26
STATA for beginners course: Stats basics, creating variables, data entry, descriptive stats
 0:06:54
Summary Statistics in Stata: Analyze Data Like a Pro
 0:02:36
Stata Tutorial: Summary/Descriptive Statistics
 0:12:41
Descriptive statistics || How to perform the summary statistics in STATA
 0:10:17
Statistics Made Easy 4.2: Descriptive Statistics in Stata
 0:17:41
OLS Method & Descriptive Statistics in STATA | STATA Tutorial
 0:04:25
Descriptive statistics in Stata
 0:18:18
Descriptive Statistics and Graphs for Categorical Variables | Stata Tutorial
 0:02:07
#StataTutorial : How to calculate descriptive statistics in STATA? #summarize #StataForBeginners
 0:10:50
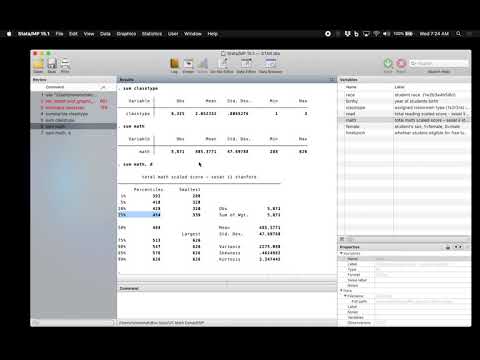
(Stata13) - Panel Data Descriptive Analysis (Tables) #paneldata #tables #descriptivestats
 0:21:29
STATA Quantitative Data Analysis: Recoding Variables & Making Descriptive Stats
 0:16:35
Stata: Summary Statistics
 0:00:22
Summary statistics in STATA Software
 0:07:51
Easily create Descriptive / Summary Statistics from Stata in Word with asdoc
 0:11:44
Stata Tutorial: Descriptive statistics
Комментарии