filmov
tv
Graphing by Plotting Points - Linear (L6.3)

Показать описание
This video explains how to graph an equation by completing a table of values. The scaling the the horizontal and vertical axes is also discussed.
Content created by Jenifer Bohart and Amy Volpe from Scottsdale CC (License CC-BY-SA 4.0)
Content created by Jenifer Bohart and Amy Volpe from Scottsdale CC (License CC-BY-SA 4.0)
 0:05:42
How to Plot Points a Coordinate Plane | Positive and Negative Coordinates | Math with Mr. J
 0:10:14
Algebra Basics: Graphing On The Coordinate Plane - Math Antics
 0:05:22
Graphing Equations by Plotting Points - Example 1
 0:06:37
Graphing Equations By Plotting Points - Part 1
 0:08:11
How to Graph a Linear Equation by Plotting Points (Using a table of values)
 0:05:35
Graphing a Line by Plotting Points
 0:05:57
Drawing Linear Graphs
 0:06:56
Graphing in Algebra: Ordered Pairs and the Coordinate Plane
 0:04:13
Miss Mushroom’s Math's Class, Lesson 13: Graphing Coordinates
 0:07:27
Plotting Points In a Three Dimensional Coordinate System
 0:05:15
Solving Systems of Equations By Graphing
 0:12:39
Graphing On The Coordinate Plane Explained!
 0:05:40
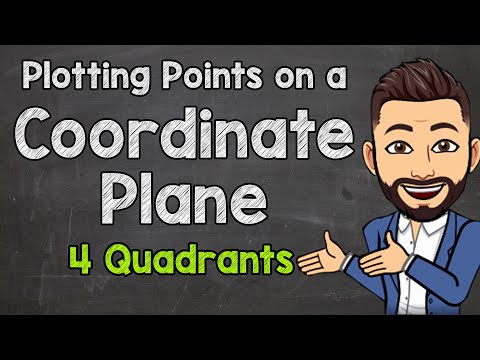
Plotting Points on a Coordinate Plane | All 4 Quadrants
 0:10:24
Graphing by Plotting Points - Linear (L6.3)
 0:08:05
Graphing Functions by Plotting Points - Linear (L8.4)
 0:02:51
Graphing Equations by Plotting Points - Example 3
 0:05:53
Graphing on the Coordinate Plane
 0:13:10
Graphs of linear equations | Linear equations and functions | 8th grade | Khan Academy
 0:12:22
Graphing Functions by Plotting Points
 0:04:17
Plot Straight Line Graphs | Graphs | Maths | FuseSchool
 0:06:51
How to Plot Points on a Cartesian Coordinate Plane? Ordered Pairs - Grade 8 Math
 0:02:39
How to Draw a Graph - WORKED EXAMPLE - GCSE Physics
 0:05:39
Graphing Data by Hand
 0:26:32
Learn Graphing, Coordinate Plane, Points, Lines, X-Axis, Y-Axis & Ordered Pairs - [5-7-1]
Комментарии