filmov
tv
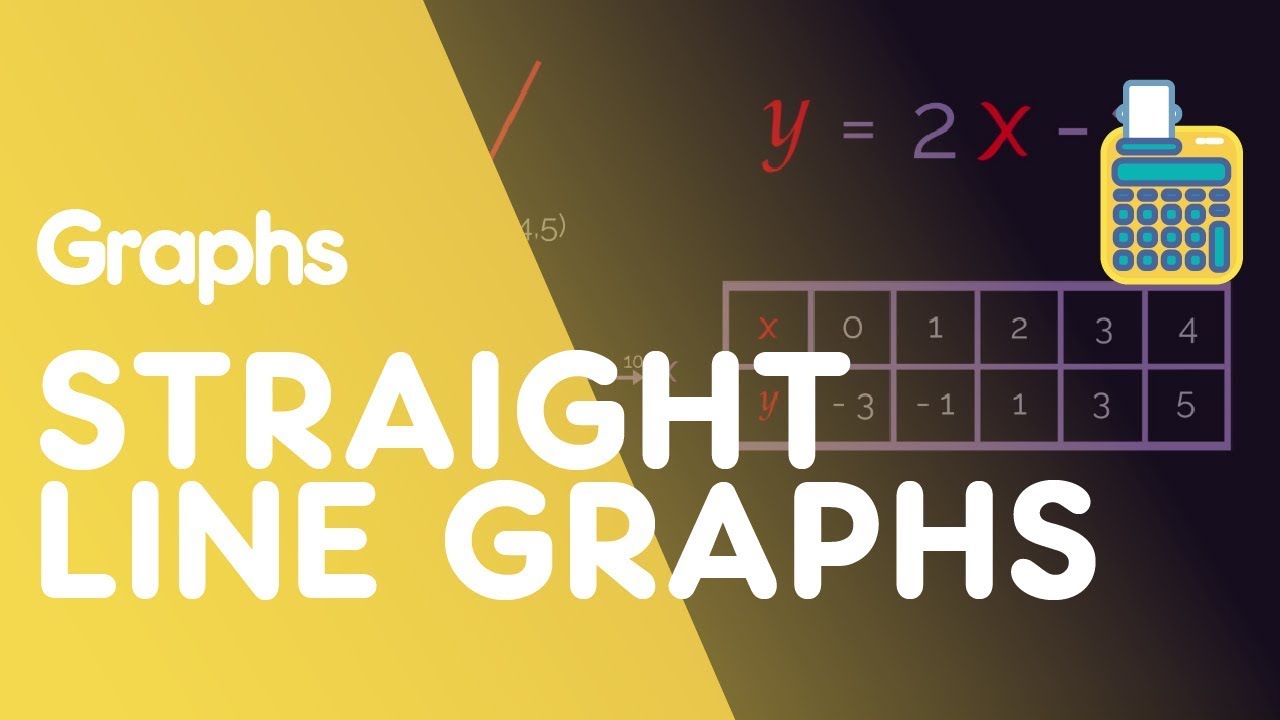
Plot Straight Line Graphs | Graphs | Maths | FuseSchool
Показать описание
Watch this video to discover how to plot straight lines onto a graph.
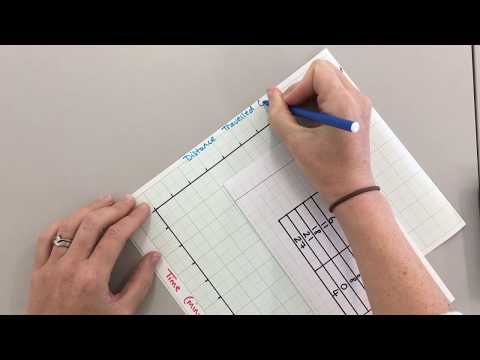
Start by creating a table of values, choosing values of x to substitute in to the equation, to get the corresponding value of y. This will generate sets of coordinates, which you can then plot onto the graph.
You need a minimum of 3 coordinates to draw a straight line, but 4 or 5 is better in case you make a mistake.
In part 2, we will look at a trickier example.
SUBSCRIBE to the FuseSchool YouTube channel for many more educational videos. Our teachers and animators come together to make fun & easy-to-understand videos in Chemistry, Biology, Physics, Maths & ICT.
These videos can be used in a flipped classroom model or as a revision aid.
Find all of our Chemistry videos here:
Find all of our Biology videos here:
Find all of our Maths videos here:
 0:04:17
Plot Straight Line Graphs | Graphs | Maths | FuseSchool
 0:06:45
GCSE Maths - How to Plot a Straight Line Using a Table of Coordinates #70
 0:00:54
Straight-Line Graphs: Find Gradient From Graph (m = Positive) (Grade 4) - GCSE Maths Revision
 0:19:10
Drawing Straight Line Graphs
 0:20:29
Drawing Straight Line Graphs - GCSE Maths
 0:04:28
GCSE Maths - How to Find the Equation of a Straight Line (y = mx + c) #68
 0:03:47
GCSE Maths - Plotting a Line by Finding Where it Crosses the Axes #71
 0:08:04
Straight line graphs grade 9: Draw
 2:00:13
Road to NODES: Mastering Retrieval-Augmented Generation with the GraphRAG Python Package
 0:05:57
Drawing Linear Graphs
 0:04:53
GCSE Maths - What on Earth is y = mx + c #67
 0:10:05
How To Find The Equation of a Line From a Graph | Algebra
 0:06:49
Plotting Straight-Line Graphs | GCSE Maths | Addvance Maths 😊➕
 0:06:41
Graphing Straight Lines (1 of 2: Interpreting equations as graphs)
 0:01:58
Straight line graphs : plotting y=3x-2
 0:05:42
How to Plot Points a Coordinate Plane | Positive and Negative Coordinates | Math with Mr. J
 0:05:33
Learn to graph a line in slope intercept form
 0:02:48
Drawing a Straight Line Graph of the Form y = mx + c
 0:33:27
Equation of a Line (Straight Line Graphs) | Part 1 | Grade 5+ Maths Series | GCSE Maths Tutor
 0:03:52
How to draw a straight line graph using the gradient and intercept method (linear graphs).m2ts
 0:06:48
GCSE Maths - How to Find the Gradient of a Straight Line #65
 0:05:35
Drawing Line Graphs
 0:06:52
Creating a Line of Best Fit on Excel
 0:17:26
All of Straight Line Graphs in 20 Minutes! | Chapter 5 | A-Level Pure Maths Revision
Комментарии