filmov
tv
Excel Solver Demo: Fitting Data to Logistic Growth Model -- AIDS Deaths

Показать описание
In this video we look at using Microsoft Excel's Solver Add-In to fit data (AIDS deaths 1982-1992) to a Logistic Growth Model. We plot the data along with the Logistic Growth Model. We start by adjusting the fitting parameters (the maximum value, the half-way position, and the growth rate) by hand. Then we calculate the sum of the square deviations and use Solver to minimize it by varying the fitting parameters.
 0:11:54
Excel Solver Demo: Fitting Data to Logistic Growth Model -- AIDS Deaths
 0:11:48
Excel Solver Demo: Fitting Chemistry Peak Data to a Lorentzian Form
 0:17:25
Excel Demo: Using Solver to Fit Data for a Charging Capacitor
 0:14:12
Excel Demo: Fitting Data to a Logistic Growth Model
 0:07:37
ASTM 1074-Fitting Compressive Strength Data Using Microsoft Excel Solver Function
 0:12:25
How To Use The Solver Tool In Excel To Solve Systems of Linear Equations In Algebra
 0:06:22
Modeling with Excel Solver Foundation 3.0 - Demo
 0:05:52
Non linear curve fitting in EXCEL for multiple datasets
 0:07:09
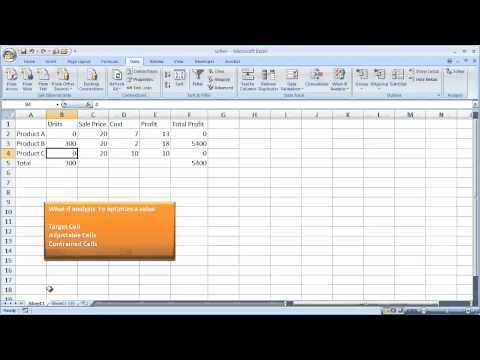
Microsoft Excel SOLVER - How to use SOLVER to optimize or simulate scenarios | Evolutionary Engine
 0:01:06
Quick demo of polynomial curve fit with Excel (Macintosh)
 0:12:56
How to use Solver in Excel
 0:12:14
Using Excel Solver to Solve a Given Mathematical Model
 0:01:02
Enabling Solver and Data Analysis Add-Ins in Excel 2007
 0:11:08
Introduction to Designing Optimization Models Using Excel Solver
 0:12:23
EXCEL PRO TIP: Advanced Optimization with Solver
 0:06:58
Use the Excel Solver Tool
 0:14:56
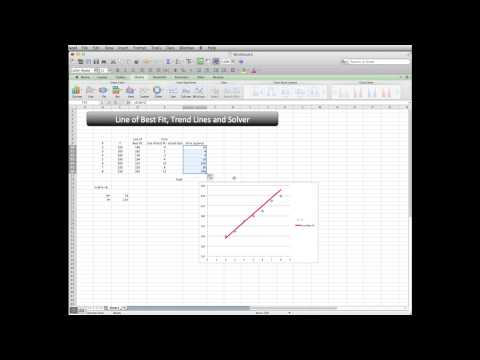
Excel Line Of Best Fit, Trend Lines, Solver
 0:00:29
IQ TEST
 0:01:50
Graphing data in Excel and finding a linear fitting equation.
 0:08:07
Microsoft Excel Solver for Engineering Optimization
 0:04:19
Excel 9: Using Solver
 0:06:53
Generating Standard Curve and Determining Concentration of Unknown Sample in Excel
 0:19:37
Excel Solver Basics Tutorial - Dr Kenneth Chelst- Wayne State University
 0:07:26
Fitting a model to data with Excel
Комментарии