filmov
tv
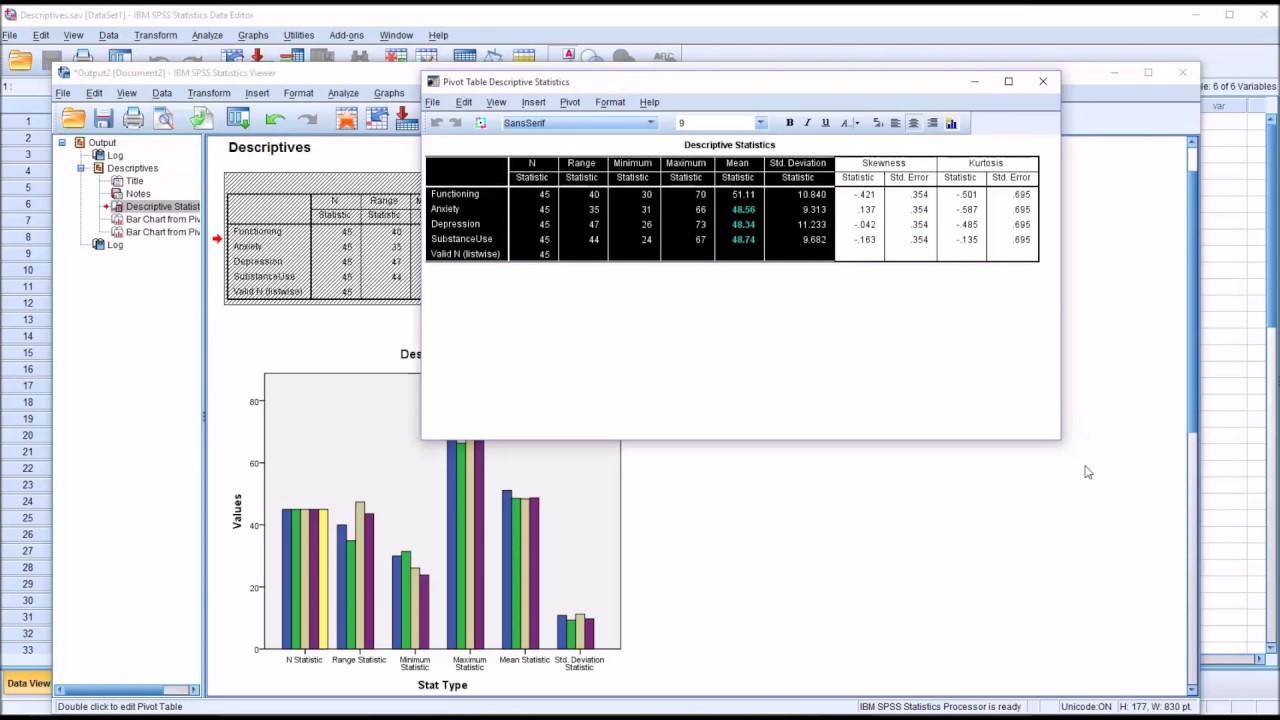
Calculating Descriptive Statistics in SPSS
Показать описание
This video demonstrates how to calculate descriptive statistics using the “Descriptives” function in SPSS. Descriptive statistics covered include the mean, standard deviation, minimum, maximum, range, skewness, and kurtosis. Formatting values using the “Style” option is reviewed.
 0:10:51
Calculating Descriptive Statistics in SPSS
 0:00:45
SPSS - Mean, Median, Mode, Standard Deviation & Range
 0:01:45
SPSS tutorial 5: How to do Descriptive Analysis
 0:07:46
03 Descriptive Statistics and z Scores in SPSS – SPSS for Beginners
 0:03:50
SPSS (7): Descriptive Statistics | Mean, Range, Standard Deviation, Skewness, Kurtosis
 0:02:48
Calculating the Mean and Standard Deviation Using the Descriptives Procedure in SPSS
 0:10:04
Calculating Descriptive Statistics in SPSS using the 'Frequencies' Function
 0:13:46
How to check Data Normality, calculate and interpret descriptive statistics in SPSS (Lesson 7)
 1:03:36
Day 7: Mann Whitney U test and Kruskal Wallis test.
 0:14:02
02 Descriptive Statistics and Frequencies in SPSS – SPSS for Beginners
 0:04:08
SPSS: Add excel file and calculate descriptive statistics
 0:12:36
Running, Interpreting, and Reporting Descriptive Statistics using SPSS
 0:20:42
How to calculate and interpret Descriptive Statistics | Mean Median | mode | S.D | charts | in SPSS
 0:15:15
Learn SPSS in 15 minutes
 0:03:17
How to calculate the overall mean of Likert scale on SPSS
 0:01:00
How to quickly run analyses in SPSS
 0:04:05
How to analyze demographic variables in one table
 0:03:29
SPSS - Descriptive Statistics
 0:02:26
V6.1 - Descriptive Statistics Across Groups in SPSS
 0:07:17
How to calculate Descriptive Statistics in SPSS
 0:08:16
Learn SPSS data analysis, interpretation and APA reporting for beginners in 7 minutes
 0:16:55
Descriptive Statistics in SPSS
 0:24:19
Descriptive Statistics for Scale Data in SPSS 27 - Statistics with SPSS for Beginners (5 of 8)
 0:01:00
Descriptive Statistics in Excel Mean, Median, Mode, Std. Deviation,...
Комментарии