filmov
tv
Greenland Ice Mass Loss 2002-2020

Показать описание
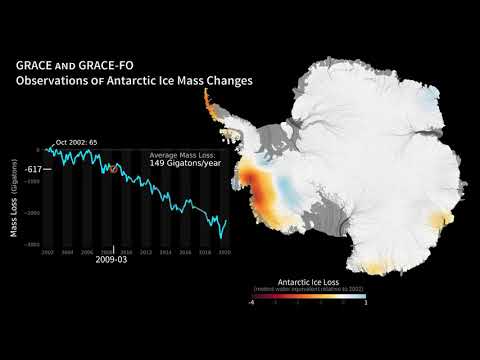
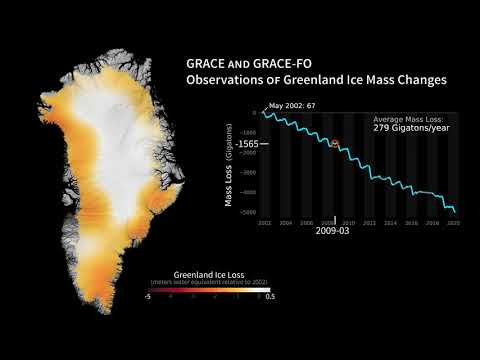
The Greenland ice sheet's mass has rapidly declined in the last several years due to surface melting and iceberg calving. Research based on satellite data indicates that between 2002 and 2020, Greenland shed approximately 280 billion metric tons of ice per year, adding to global sea level rise.
These images, created from GRACE and GRACE-FO data, show changes in Greenland ice mass since 2002. Orange and red shades indicate areas that lost ice mass, while light blue shades indicate areas that gained ice mass. White indicates areas where there has been very little or no change in ice mass since 2002.
In general, higher-elevation areas near the center of Greenland experienced little to no change, while lower-elevation and coastal areas experienced over 16.4 feet (5 meters) of ice mass loss (expressed in equivalent-water-height; dark red) over this 19-year period. The largest mass decreases occurred along the West Greenland coast.
The average flow lines (gray; created from satellite radar interferometry) of Greenland’s ice converge into the locations of prominent outlet glaciers and coincide with areas of highest mass loss. This supports other observations that warming ocean waters around Greenland play a key role in contemporary ice mass loss.
 0:00:37
Greenland Ice Mass Loss 2002-2020
 0:02:16
Greenland and Antarctic Ice Mass Loss 2002-2020
 0:00:51
Greenland Ice Mass Loss 2002-2023
 0:00:47
Greenland Ice Mass Loss 2002-2021
 0:00:34
Greenland ice loss 2002-2016
 0:00:37
Antarctic Ice Mass Loss 2002-2020
 0:00:51
GRACE Satellite shows Greenland Mass Loss
 0:00:51
Antarctic Ice Mass Loss 2002-2023
 0:04:23
Ice sheet mass loss observed by NASA’s ICESat missions
 0:26:35
Greenland Ice Sheet: Is It Past A Point of No Return? Featuring Dr. Michalea King
 0:00:37
GRACE and GRACE FO: Observations of Greenland Ice Mass Changes
 0:00:58
Greenland Lost 600 Billion Tons of Ice Last Summer, NASA Data Shows
 0:00:43
How Much Ice Greenland Lost 2002 - 2020
 1:27:09
Jason Briner: The rate of ice mass loss in Greenland | SEES Fall 2020 Colloquium
 0:00:34
Antarctic ice loss 2002-2016
 0:09:58
2 Overview of Ice Melting and Contributions to Sea Level Rise
 0:01:07
Greenland ice flow
 0:29:15
Uncover the Urgency: The Melting Greenland Ice Sheet Explained
 0:09:17
Greenland Ice Melting 2022: Arctic Ice Loss at 4,700 Gigatons in Two Decades
 0:01:25
Animation - Greenland ice losses
 0:00:23
Greenland Ice Loss #shorts #greenland
 0:00:51
Antarctic Ice Mass Loss 2002 2023
 0:02:01
'Zombie ice' to raise sea level as Greenland ice sheet melts
 0:00:15
Underwater Nuclear Bomb Test 1958 - Tsunami Bom 😱😱
Комментарии