filmov
tv
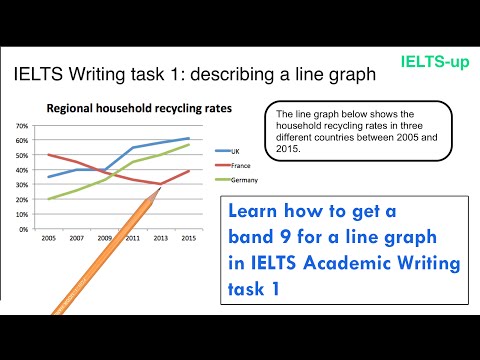
How to Describe a Graph - GEOGRAPHY BASICS

Показать описание
#geographybasics #geogbasics #geography
How to describe a graph
1) Title
2) Trend
3) Axis
4) Data
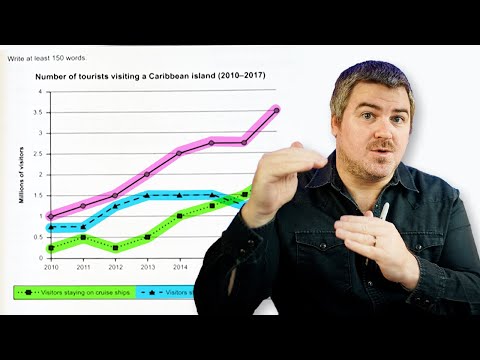
Describe how the urban population has changed throughout the years. (2)
Overall the percentage of the world population living in urban areas has been increasing.
In 1950 only 30% of the world's population lived in cities, but it has been steadily increasing each decade with around 55% of the world's population choosing to settle in the city environment by 2020. If this trend continues into the future towards 2050 it is estimated to reach 70%.
Check out the rest of the Geography Basics playlist here:
Additional Footage fully licenced from:
Music:
Chris Hau + Gabe Gallucci Volume 1
Thanks for the support.
How to describe a graph
1) Title
2) Trend
3) Axis
4) Data
Describe how the urban population has changed throughout the years. (2)
Overall the percentage of the world population living in urban areas has been increasing.
In 1950 only 30% of the world's population lived in cities, but it has been steadily increasing each decade with around 55% of the world's population choosing to settle in the city environment by 2020. If this trend continues into the future towards 2050 it is estimated to reach 70%.
Check out the rest of the Geography Basics playlist here:
Additional Footage fully licenced from:
Music:
Chris Hau + Gabe Gallucci Volume 1
Thanks for the support.
 0:07:28
 0:03:43
 0:03:39
 0:29:12
 0:10:04
 0:05:07
 0:02:42
 0:00:30
 1:05:44
 0:07:45
 0:18:26
 0:02:11
 0:09:23
 0:03:06
 0:04:43
 0:12:03
 0:09:06
 0:01:16
 0:15:26
 0:14:00
 0:00:30
 0:18:06
 0:00:57
 0:00:26