filmov
tv
Descriptive statistics - Lecture 4 - Data analysis using R

Показать описание
An example of a data API for Social Sciences. Lecture 4 contains the Answers (L3) and goes into Descriptive Statistics and how you can compute them with R. What are central tendencies? (mean, median, mode), Dispersion Measurements (range, quantiles, variance, standard deviation, outliers) and Shape Parameters / indicators (skewness, kurtosis) ?
Chapters:
00:00:00 - Sound check and introduction
00:05:49 - Overview of the lecture
00:10:58 - Answers to Assignments Lecture 3
01:13:00 - Break 1: Fox gifs
01:19:25 - Answers to Assignments Lecture 3 (Continued)
02:06:07 - Break 2: Wombat gifs
02:12:40 - Start of lecture 4
02:13:18 - Data APIs for Social Sciences
02:35:59 - Univariate versus Bivariate statistical analysis
02:38:04 - Central tendencies: Different types of means
02:45:00 - Central tendencies: Median
02:46:07 - Central tendencies: Mode
02:46:50 - Dispersion measures: Range
02:47:52 - Dispersion measures: Quantiles
02:49:33 - Dispersion measures: Variance & Standard Deviation
02:52:24 - Outliers and Data Winsorizing
02:57:27 - Shape measures: Skewness
02:58:35 - Shape measures: Kurtosis (Meso, Lepto, Platy)
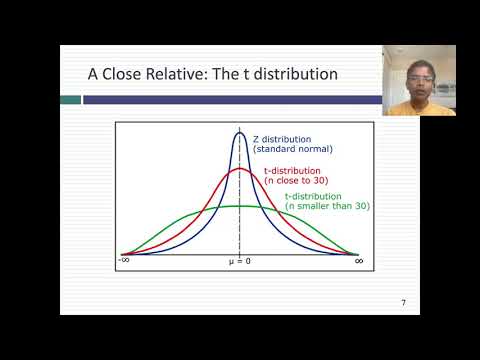
03:00:00 - Normality in statistical tests
03:01:30 - Shapiro-Wilk normality testing in R
03:02:33 - Plots for univariate statistics
03:11:00 - Graphical parameters in R
03:12:03 - How to create a plot in R
03:14:30 - Multiple plots in a single R window
03:16:17 - Apply and subset functions in R
03:18:52 - Next week, Questions & outro
#rlanguage #programmingforstudents #lectureseries #statistics #assignments #coding #livestream #socialscience #lectures #playlist #education #educationalvideos #msc #phd #english #statisticsfordatascience #academia #academicyoutube #rpackages #answers #distributions #skewness #kurtosis #statistics #univariate #winsorizing #dispersion #normality #socialscience #api #outliers #plotting #descriptivestatistics
Chapters:
00:00:00 - Sound check and introduction
00:05:49 - Overview of the lecture
00:10:58 - Answers to Assignments Lecture 3
01:13:00 - Break 1: Fox gifs
01:19:25 - Answers to Assignments Lecture 3 (Continued)
02:06:07 - Break 2: Wombat gifs
02:12:40 - Start of lecture 4
02:13:18 - Data APIs for Social Sciences
02:35:59 - Univariate versus Bivariate statistical analysis
02:38:04 - Central tendencies: Different types of means
02:45:00 - Central tendencies: Median
02:46:07 - Central tendencies: Mode
02:46:50 - Dispersion measures: Range
02:47:52 - Dispersion measures: Quantiles
02:49:33 - Dispersion measures: Variance & Standard Deviation
02:52:24 - Outliers and Data Winsorizing
02:57:27 - Shape measures: Skewness
02:58:35 - Shape measures: Kurtosis (Meso, Lepto, Platy)
03:00:00 - Normality in statistical tests
03:01:30 - Shapiro-Wilk normality testing in R
03:02:33 - Plots for univariate statistics
03:11:00 - Graphical parameters in R
03:12:03 - How to create a plot in R
03:14:30 - Multiple plots in a single R window
03:16:17 - Apply and subset functions in R
03:18:52 - Next week, Questions & outro
#rlanguage #programmingforstudents #lectureseries #statistics #assignments #coding #livestream #socialscience #lectures #playlist #education #educationalvideos #msc #phd #english #statisticsfordatascience #academia #academicyoutube #rpackages #answers #distributions #skewness #kurtosis #statistics #univariate #winsorizing #dispersion #normality #socialscience #api #outliers #plotting #descriptivestatistics
 0:13:31
Level I CFA: Quant Statistical Concepts and Market Returns-Lecture 4
 0:52:54
Measure of dispersion Ex 13.3 | Lecture- 4 | Descriptive Statistics Ch- 13 | skewness and kurtosis
 0:56:46
Introduction to Statistics
 0:42:09
Teach me STATISTICS in half an hour! Seriously.
 8:15:04
Statistics - A Full University Course on Data Science Basics
 0:57:02
4. Descriptive and Analytical Studies | CPP NCD Epidemiology
 0:14:56
Session 4: Statistical Distributions
 0:14:34
Mean, Median, and Mode of Grouped Data & Frequency Distribution Tables Statistics
 0:17:55
Probability mass function || Problems and solutions || Random variables
 0:08:02
Medical Statistics Lecture 4 Sensitivity, Specificity and Predictive Values
 0:03:02
Descriptive Statistics - Mean & Standard Deviation
 0:01:45
SPSS tutorial 5: How to do Descriptive Analysis
 0:00:45
SPSS - Mean, Median, Mode, Standard Deviation & Range
 0:14:59
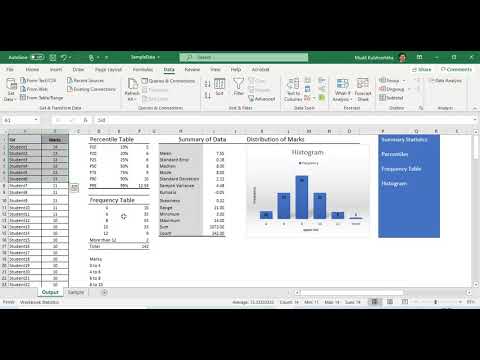
Statistics in Excel Tutorial 1.1. Descriptive Statistics using Microsoft Excel
 0:03:21
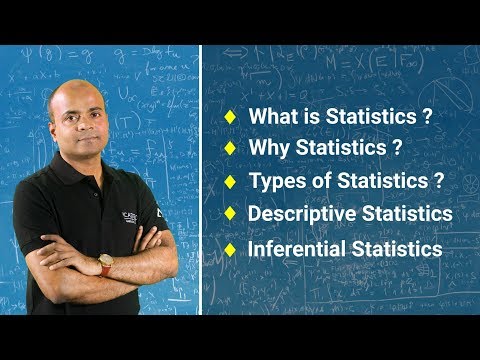
What is Statistics? | Types of Statistics | Descriptive & Inferential Statistics | Acadgild
 0:10:15
Using Stata Creating a Table of Descriptive Statistics
 0:12:36
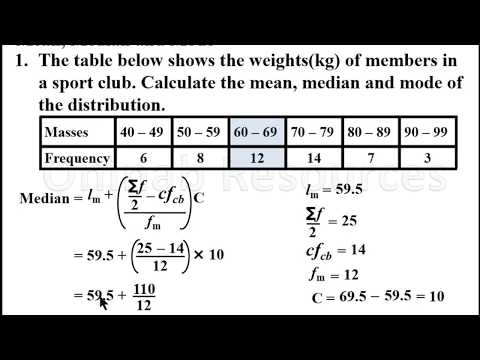
Mean, median and mode of grouped Data(Lesson 1)
 0:06:02
Skewness And Kurtosis And Moments | What Is Skewness And Kurtosis? | Statistics | Simplilearn
 0:09:33
Measure of Dispersion | Range, Quartiles, Mean Deviation, Variance and Standard Deviation
 0:07:50
Statistics - Mean, Median & Mode for a grouped frequency data
 0:13:11
Tutorial 22-Univariate, Bivariate and Multivariate Analysis- Part1 (EDA)-Data Science
 0:13:50
LESSON 72 - CHAPTER FOUR || DATA ANALYSIS, PRESENTATION, INTERPRETATION & DISCUSSION OF FINDINGS
 0:03:14
Statistics: Ch 2 Graphical Representation of Data (1 of 62) Types of Graphs
 0:12:29
Mean deviation, variance and standard deviation of grouped data.
Комментарии