filmov
tv
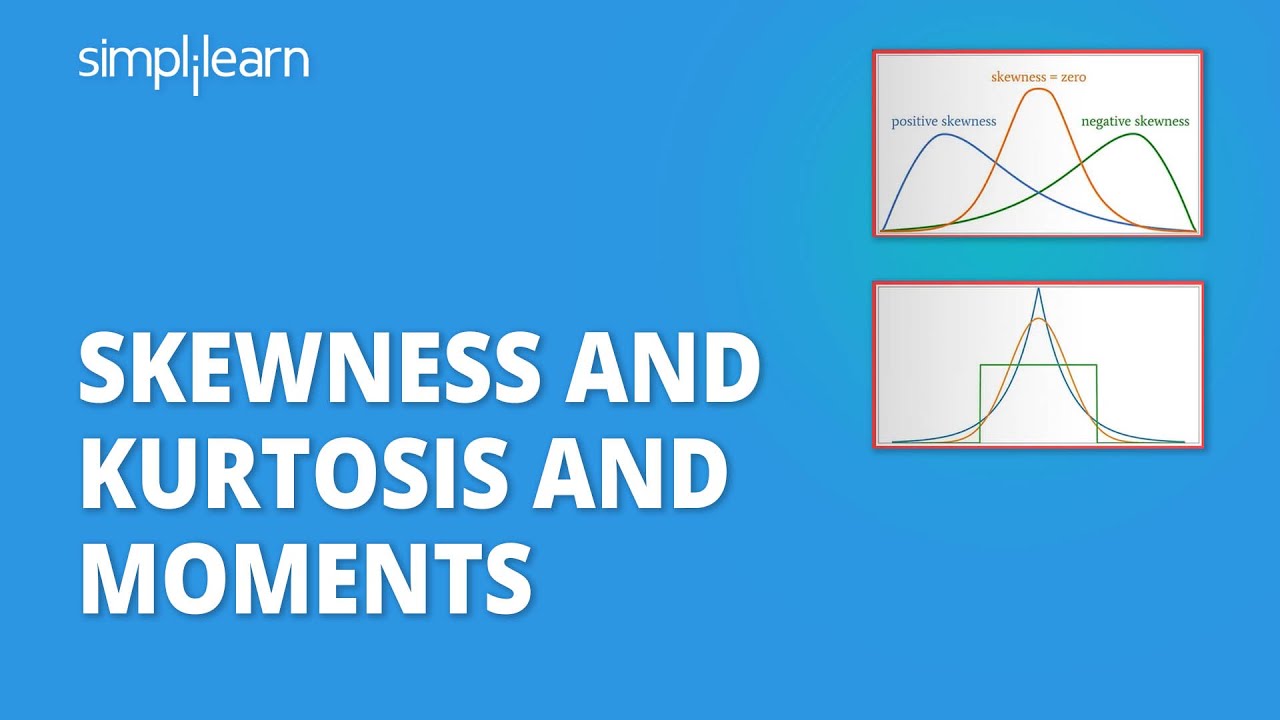
Skewness And Kurtosis And Moments | What Is Skewness And Kurtosis? | Statistics | Simplilearn
Показать описание
This video, Skewness And Kurtosis And Momentsby Simplilearn, will explain what is skewness and Kurtosis in detail. This lecture on Skewness & Kurtosis And Moments will discuss symmetrical and skewed distribution in Statistics. In addition, you will learn how to calculate Pearson's coefficient of skewness and what kurtosis is.
Here we will discuss the following
00:00 Skewness And Kurtosis And Moments
01:12 Skewed Distribution
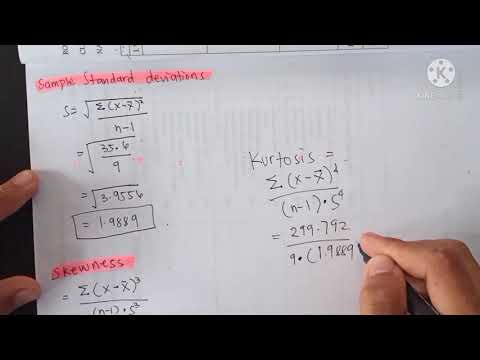
03:04 Pearson's Coefficient of Skewness
04:10 Kurtosis
#PercentilesAndQuartilesInStatistics #PercentilesAndQuartilesInStatisticsExplained #WhatArePercentilesAndQuartiles #WhatIsPercentile #WhatIsQuartile #StatisticsBasics #LearnStatistics #Simplilearn
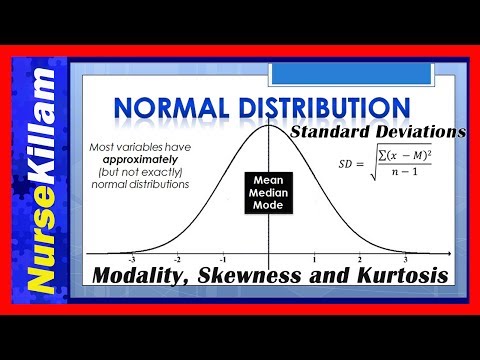
What is Skewness?
Skewness is used to measure the level of asymmetry in our graph. It is the measure of asymmetry that occurs when our data deviates from the norm.
What is Kurtosis?
Kurtosis is a statistical measure that defines how heavily the tails of a distribution differ from the tails of a normal distribution. In other words, kurtosis identifies whether the tails of a given distribution contain extreme values.
➡️ About Post Graduate Program In AI And Machine Learning
This AI ML course is designed to enhance your career in AI and ML by demystifying concepts like machine learning, deep learning, NLP, computer vision, reinforcement learning, and more. You'll also have access to 4 live sessions, led by industry experts, covering the latest advancements in AI such as generative modeling, ChatGPT, OpenAI, and chatbots.
✅ Key Features
- Post Graduate Program certificate and Alumni Association membership
- Exclusive hackathons and Ask me Anything sessions by IBM
- 3 Capstones and 25+ Projects with industry data sets from Twitter, Uber, Mercedes Benz, and many more
- Master Classes delivered by Purdue faculty and IBM experts
- Simplilearn's JobAssist helps you get noticed by top hiring companies
- Gain access to 4 live online sessions on latest AI trends such as ChatGPT, generative AI, explainable AI, and more
- Learn about the applications of ChatGPT, OpenAI, Dall-E, Midjourney & other prominent tools
✅ Skills Covered
- ChatGPT
- Generative AI
- Explainable AI
- Generative Modeling
- Statistics
- Python
- Supervised Learning
- Unsupervised Learning
- NLP
- Neural Networks
- Computer Vision
- And Many More…
🔥🔥 Interested in Attending Live Classes? Call Us: IN - 18002127688 / US - +18445327688
 0:06:02
Skewness And Kurtosis And Moments | What Is Skewness And Kurtosis? | Statistics | Simplilearn
 0:10:22
Skewness - Right, Left & Symmetric Distribution - Mean, Median, & Mode With Boxplots - Stati...
 0:15:44
What are 'moments' in statistics? An intuitive video!
 0:15:12
What is skewness? A detailed explanation (with moments!)
 0:13:39
Skewness and Kurtosis : the two summary stats they never taught you
 0:03:24
What is Skewness? | Statistics | Don't Memorise
 0:08:21
What is Skewness & Kurtosis ? | Difference Between Skewness and Kurtosis in Statistics
 0:17:37
Skewness & Kurtosis | Moments | Leptokurtic, Mesokurtic, Platykurtic
 0:08:36
MEAUSRE OF SKEWNESS & KURTOSIS USING MOMENTS EXAMPLE NO. 1 #STATISTICS4ALL #SKEWNESS #KURTOSIS
 0:24:43
Moments skewness and kurtosis
 0:30:15
Skewness and Kurtosis and Moments || BBS 1st Year Business Statistics || Concept & Formula -Guru...
 0:06:51
Statistics-Left Skewed And Right Skewed Distribution And Relation With Mean, Median And Mode
 0:10:26
Moments,Skewness and kurtosis
 1:21:01
Skewness and Kurtosis and Moments || TU Solution || BBS 1st Year Business Statistics || -Gurubaa
 0:07:36
12 Moments, Skewness, and Kurtosis
 0:19:32
Skewness & Kurtosis | Moments | Leptokurtic, Mesokurtic, Platykurtic | Examples
 0:38:40
Skewness, kurtosis and moments # part-1
 0:06:07
Grouped data of skewness and kurtosis
 0:17:35
Skewness and Kurtosis By Moments Method Part 1 Introduction Business Statistics 1st year in Nepali
 0:00:43
SKEWNESS IN STATISTICS EXPLAINED IN LESS THAN A MINUTE!! #statistics #datascience #skewness
 0:39:01
Introduction to Moments Skewness and Kurtosis|Statistics|BBA|BCA|B.COM|Dream Maths
 0:14:27
Skewness and Kurtosis and Moments | Moment about Mean | Kurtosis Examples | Skewness Example |Moment
 0:05:07
Normal Distributions, Standard Deviations, Modality, Skewness and Kurtosis: Understanding concepts
 0:09:10
BCA | Statistics | Skewness | Karl Pearson's and Bowley's co-efficient of Skewness.
Комментарии